×

It’s not goodbye, it’s hello Magnifi!

You are now leaving a Magnifi Communities’ website and are going to a website that is not operated by Magnifi Communities. This website is operated by Magnifi LLC, an SEC registered investment adviser affiliated with Magnifi Communities.

Magnifi Communities does not endorse this website, its sponsor, or any of the policies, activities, products, or services offered on the site. We are not responsible for the content or availability of linked site.

Take Me To Magnifi

Magnifi Communities

Strong Jobs Report Abates Fears of Recession

Last week, the jobs report was released. Economists were expecting an additional 258,000 new jobs added last month. The Labor Department’s report revealed that the U.S. economy has had robust job growth last month adding over 500,000 jobs in July.
The exceedingly strong numbers of the report diminished concerns about the United States entering a recession. While this optimistic report bodes well for economic growth, it certainly does not address inflation.
However, it does change market sentiment which had been intensely focused on the last two GDP reports. On July 28 the government released the advance estimate of the second quarter GDP. The report revealed that the GDP had decreased at an annual rate of 0.9% during the second quarter of 2022.
[embedded content]
Earlier this year the BEA reported a decrease in the first quarter GDP of 1.6%. The widely accepted definition of a recession is an economic contraction over two consecutive quarters.

The fear of a disappointing jobs report that pressured yields on U.S. Treasuries and the dollar lower was reversed. The dollar gained 0.8% which is equal to Thursday’s decline. Gold gave up roughly half of the $30 gain Thursday declining by $14.50 on Friday. As of 6:25 PM EDT on Friday, gold futures basis the most active December contract was fixed at $1792.40.
Spot or physical gold lost $15.57 and was fixed at $1776.40 according to the Kitco Gold Index. On closer inspection, the KGX revealed that $13.60 of Friday’s decline of was a direct result of dollar strength, and a fractional decline of $1.20 was the result of traders bidding gold fractionally lower.
Gold futures closed above $1800 Thursday and the 50-day moving average was significant, however, very short-lived. It is also less likely that we will see gold recover quickly in that Friday’s jobs report strengthens the resolve of the Federal Reserve to raise rates by another 75 basis points in September.
This will also be highly supportive of the U.S. dollar as we saw in trading today.
According to Michael Hewson, chief market analyst at CMC markets, “Today’s labor market report is bad news for gold bulls, with next week’s CPI report the next key test,” the bearish sentiment reflected in the above quote was a common theme amongst other analysts.

Bart Melek, head of commodity strategies at TD Securities said, “Gold had recently rallied on the thought that the Fed will shift from hawkish to dovish. But the jobs data shows the U.S. economy is strong, and this can prompt the Fed to be more aggressive, which is not a good story for gold,” Melek added that the “next catalyst for gold prices will be the US CPI print coming out next week.”
The only wildcard is if there is an increase in geopolitical concerns regarding Russia’s war in Ukraine and/or China’s response to Nancy Pelosi’s visit to Taiwan.
For those who would like more information simply use this link.
Wishing you, as always good trading,Gary S. WagnerThe Gold Forecast

Strong Jobs Report Abates Fears of Recession Read More »

blue solar panel board

3 Solar Stocks to Sell, Avoid or Liquidate Now

The Biden-Harris administration recently announced $56 million in funding to fortify innovation in solar manufacturing and recycling. In addition, the Senate passed the historic climate bill, which might accelerate growth in the solar industry. Although the solar industry witnessed substantial growth over the past decade, supply chain constraints and trade instability have led to price

3 Solar Stocks to Sell, Avoid or Liquidate Now Read More »

Crypto Update: It Ain’t Over Yet

It was a close call this May with a doom-saying title “Crypto Apocalypse?” where I shared with you an annihilating model for Ethereum and a bearish chart of Bitcoin.
Let us see what happened in the crypto market since then in the chart below.
Source: TradingView
Total crypto market cap had skyrocketed to the maximum of just over $3 trillion last November. Since then, almost ¾ of the total market cap has evaporated on the crypto crash down to $762 billion this June. That hurts!

More than $2 trillion of wealth was destroyed during that collapse. Some people were calling it a “crypto-winter” of the market. All of us have probably noticed that less videos and posts with clickbait titles on “how to become a crypto-millionaire” or new rising stars in the crypto-market have been popping up on social media lately.
In the next market share chart, let’s check the status quo of the market leaders.
Source: TradingView
During the collapse of the market, the main coin (orange) has managed to increase its market share tremendously from 40% up to 48% on the peak in June. How could that happen as it was bleeding alongside the whole market? The speed of the drop is the main reason.
Bitcoin was falling slower than the rest of the market as some coins, even in top 20 tier, were busted very rapidly. Just look at the second largest coin Ethereum, it was losing its market share badly from 22% down to 15%, a level unseen since last January.
These days, both top coins are moving back to its historic boundaries. So, the status quo of the market remains unchanged. Bitcoin has a small surplus and Ethereum is leaking wounds as it is still in the red. However, the latter could take this chance to bounce off the valley to break up this long standing equilibrium.
Watch the Ethereum merge set for September 19th when the Ethereum completes its transition from the energy-intensive proof-of-work (PoW) consensus mechanism to a more environment-friendly proof-of-stake(PoS) mechanism.

 Loading …
An updated chart of Bitcoin is up next. Most of you accurately predicted the valley of the Bitcoin collapse in the range of $15k-$20k. Kudos to you!
Source: TradingView
This is the updated original chart I posted this May when the price of the main coin was close to $35k. The anticipated crash in the second red leg down almost hit the preset target at $12.2k. The price of Bitcoin has halved to revisit the $17.6k level unseen since December 2020.
The Volume Profile indicator (orange) proved the idea that the price should drop huge once it slides into the volume gap area between $29k and $10k. Indeed, the collapse was fast and huge on this trigger. The price is still in that low-volume trap. Moreover, the current rise of the price doesn’t look convincing as it resembles the sideways consolidation pattern ahead of another drop. So, it ain’t over yet.

The recent valley of $17.6k is the minimum target of a possible drop. The earlier preset target based on equality of two red legs down is still intact at $12.2k. Breakdown below $10k would open way in the $4k area according to the Volume Profile indicator.
The breakup back above $29k is needed to restart the bullish cycle for the main coin.

 Loading …
Intelligent trades!
Aibek BurabayevINO.com Contributor
Disclosure: This contributor has no positions in any stocks mentioned in this article. This article is the opinion of the contributor themselves. The above is a matter of opinion provided for general information purposes only and is not intended as investment advice. This contributor is not receiving compensation (other than from INO.com) for their opinion.

Crypto Update: It Ain’t Over Yet Read More »

2 Winning Stocks to Pay Attention to This Week

Last month, the Federal Reserve raised the benchmark interest rates by 75 basis points for the second consecutive month to tame the multi-decade high inflation. The U.S. economy contracted 0.9% in the second quarter, making many analysts believe that a recession has already arrived. Despite the uncertain macroeconomic conditions, inflation-adjusted consumer spending continued to rise.

2 Winning Stocks to Pay Attention to This Week Read More »

worms eyeview of green trees

Only This Kind of Company Can Save Your Portfolio

I’ve come to think that while some companies strive to make Wall Street analysts and large portfolio managers happy, others put common investors like us first. A company’s dividend policy will be a telling factor about on which side a company’s management team and board of directors fall.

Small investor-friendly companies pay out a significant portion of profits or cash flow as dividends and continuously strive to grow their dividend rates. Investing in stocks like these, with attractive yields and growing dividends, is a proven strategy for building wealth.

Here are some clues that tell you a company is more focused on making the Wall Street analysts happy…

Share Buybacks

Companies refer to share buybacks as “returning capital to shareholders.” I don’t see it working that way. If my shares are repurchased, I am no longer a shareholder. The theory is that buying in shares reduces the share count, which will help increase earnings per share (EPS) for those who remain shareholders after the buyback. But as we all know, growing earnings don’t always boost the share price. Without a corresponding dividend increase, I see share buybacks as throwing money (sometimes a lot of money) down a hole.

Environmental, Social, and Governance (ESG)

Large pension and other fund managers put a lot of weight on ESG scores. These types of investment pools are so large that they have no potential to produce above-average returns, so fund managers can help themselves feel better by investing in companies that are working to save the planet.

Unfortunately, I doubt whether the ESG rules and scores, at least as they currently exist, do much good for the environment or investors. I know they can make a CEO feel better about keeping a corporate jet if they fund the seeding of the rainforest, but I have not noticed how an overly heavy focus on ESG helps my net worth grow.

In contrast to the Wall Street analysts and big money fund managers, we, as individual investors, most want to see our brokerage and retirement accounts grow with above-average total returns. How much you make depends on your risk tolerance and how aggressively you invest, but a significant portion of your returns should be in the form of cash dividends.

The shutdown of the economy due to the pandemic forced many companies to change their dividend policies. Now, two and a half years later, I am watching closely to see what companies continue their pandemic changes versus making a return to taking care of individual investors with great dividend policies.

Here are a couple of examples:

Last week, Main Street Capital (MAIN), a top-tier business development company (BDC), announced an increase in the monthly dividends the company will pay in the fourth quarter. The new dividend rate of $0.22 per share gives the third half-cent increase since the beginning of 2020. Main Street Capital also pays supplemental dividends when its profits allow, and a $0.10 bonus dividend will be paid in September. This is one of those conservative, investor-focused companies from which investors can count on stable, growing monthly dividends.

In early 2021, upstream oil and gas producer Devon Energy (DVN) announced a new dividend policy to pay out 50% of free cash flow as dividends to investors. The dividends are a combination of fixed and variable components. Since the start of 2021, the fixed dividend has grown from $0.11 per share to $0.16. Total (fixed-plus-variable) dividends paid for the last six quarters have been $0.34, $0.49, $0.84, $1.00, $1.27, and $1.55 sequentially. As the price of oil rose and Devon became more efficient, the company rewarded investors with rapidly growing dividends. Based on the $1.55 payout declared last week, DVN yields 10%.

The financial and stock market world is geared to the wants and wishes of Wall Street and the large money they advise. As individuals, we need to dig out those dividend-paying companies that want to help small investors grow their wealth and income.That’s exactly what I do with my “Diamond Dividends” strategy, which lets you increase your income by up to 108% in just 7 months, without any options or trading. See for yourself right here.

Only This Kind of Company Can Save Your Portfolio Read More »

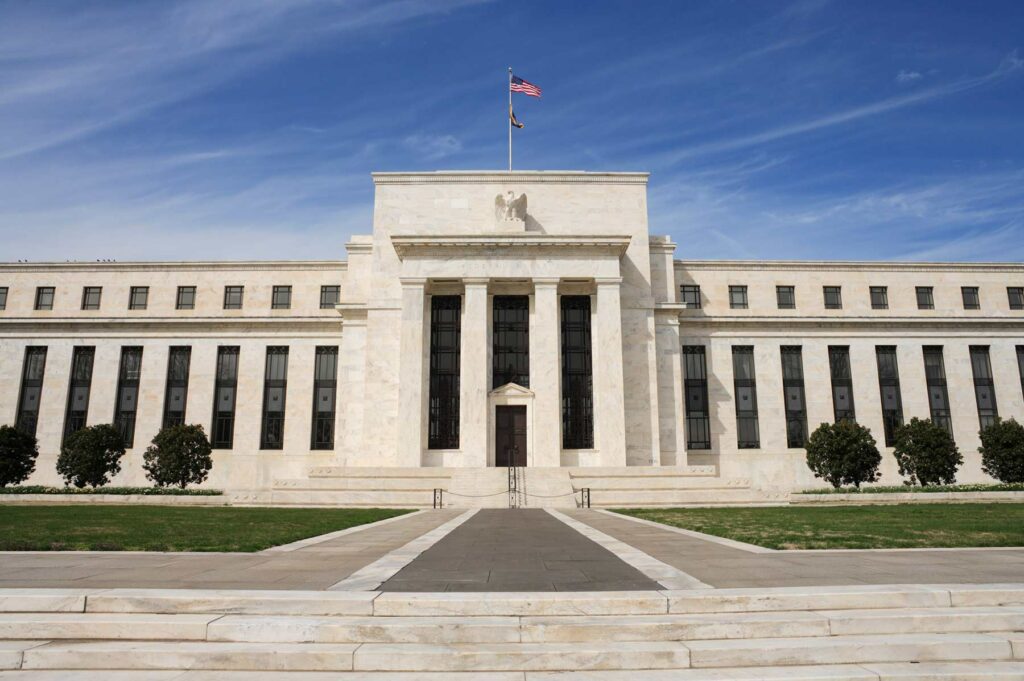
Should We Prepare For An Aggressive U.S. Fed?

Traders expect the U.S. Fed to soften as Chairman Powell suggested they have reached a neutral rate with the last rate increase. The US stock markets started an upward trend after the last 75bp rate increase – expecting the U.S. Fed to move toward a more data-driven rate adjustment.
My research suggests the U.S. Federal Reserve has a much more difficult battle ahead related to inflation, global market concerns, and underlying global monetary function.
Simply put, global central banks have printed too much money over the past 7+ years, and the eventual unwinding of this excess capital may take aggressive controls to tame.
Real Estate Data Shows A Sudden Shift In Forward Expectations
The US housing market is one of the first things I look at in terms of consumer demand, home-building expectations, and overall confidence for consumers to engage in Big Ticket spending. Look at how the US Real Estate sector has changed over the past five years.
The data comparison chart below, originating from September 2017, shows how the US Real Estate sector went from moderately hot in late 2017 to early 2018; stalled from July 2018 to May 2019; then got super-heated in late 2019 as extremely low-interest rates drove buyers into a feeding frenzy.
As the COVID-19 virus initiated the US lockdowns in March/April 2020, you can see the buying frenzy ground to a halt. Between March 2020 and July 2020, Average Days On Market shot up from -8 to +17 (YoY) – showing people stopped buying homes. At this same time, home prices continued to rise, moving from +3.3% to +14% (YoY) by the end of 2020.

The buying frenzy then kicked back into full gear and continued at unimaginable levels throughout 2021 as interest rates stayed near lows and FOMO increased.
Over the past 7+ years, the excess capital meant buyers could sell their existing homes, relocate to a cheaper area, avoid COVID risks, and reduce their mortgage costs with almost no risks. This “great relocation” event likely sparked the high inflation/CPI trends we are battling right now.
(Source: Realtor.com)
Extreme Easy Monetary Policies May Prompt A Harsh U.S. Fed Action In The Future
Traders expect the U.S. Federal Reserve to softly pivot away from rate increases after reaching a “normal level.” I believe the U.S. Federal Reserve will have to continue aggressively raising rates to battle ongoing inflation and global concerns.
I don’t believe traders have even considered what may be necessary to break this cycle – or are simply hoping they never see 14% FFR rates again (like we saw in the 1980s).
The harsh reality is the excess capital floating around the globe has anchored an inflationary trend that may be unstoppable without central banks taking interest rates to extremes. There was only one other period where I see similarities between what is taking place now and the recent past – 1970~2003.
Throughout that span of time, the U.S. Federal Reserve moved away from the Gold Standard and entered an extended period of money creation. This prompted a big increase in CPI and Inflation, leading to extreme FFR rates above 15% in 1982 to battle inflationary trends (see the charts below). CPI continued above 5% for another 15+ years after 1982 – finally bottoming in 2010.
What if the extended money printing that started after the 2007-08 Global Financial Crisis sparked another excess capital/inflation phase just like the 1970 to 2003 phase? What’s next?

Excess Money Must Unwind Over Time To Prompt A New Growth Phase
My thinking is the 2000~2019 unwinding phase, prompted by the DOT COM bubble, 911 Attacks, and the eventual 2008-09 Global Financial Crisis, pushed the devaluation of assets/excess toward extreme lows. This prompted the U.S. Federal Reserve to adopt an extended easy money policy.
COVID-19 pushed those extremes beyond anyone’s expectations – driving asset prices and the stock market into a frenzy. As inflation trends seem unstoppable, the Fed may need to take aggressive actions to thwart the global destruction of capital, currencies, and economies and avoid a massive humanitarian crisis. Run-away inflation will harm billions of people who can’t afford to buy a slice of bread if it goes unchallenged.
The U.S. Federal Reserve may be forced to raise FFR rates above 6.5~10% very quickly to avoid rampant inflation’s destructive effects. And that means traders are mistakenly assuming the U.S. Federal Reserve will pivot to a softer stance.
Real Estate Will Be The Canary In The Mine If Fed Stays Aggressive
I believe Real Estate could see an aggressive unwinding in valuation and future expectations if the U.S. Fed continues to raise rates over the next 12+ months aggressively. Once mortgage rates reach 8% or higher, home buyers and traders are suddenly going to question, “where is this going?” and “where will it end?”.

The Fed may have to break a few things to battle inflation trends. This same thing happened in the early 1980s, and real asset growth didn’t start to accelerate until the last 1990s (amid the DOT COM Bubble).
Real Estate & Financials May Show The First Signs Of Stress
I believe IYR and XLF are excellent early warning ETFs for a sudden shift in consumer/economic activity related to future Fed rate decisions.
Once the Fed moves away from expected rates/trends, the Real Estate and Financial sectors will begin to react to economic contractions and weakening consumer demand/defaults.
This potential trend is still very early in the longer-term cycle, but I believe traders are falsely focused on a possible U.S. Fed pivot, thinking the Fed will shift away from continued rate increases.
I believe the U.S. Federal Reserve must raise rates above 5.5% FFR in order to start breaking inflationary trends. That means FFR rates need to rise 125% or more from current levels (250 bp+) – which may be higher.
Learn more by visiting The Technical Traders!
Chris VermeulenTechnical Traders Ltd.
Disclosure: This article is the opinion of the contributor themselves. The above is a matter of opinion provided for general information purposes only and is not intended as investment advice. This contributor is not receiving compensation for their opinion.

Should We Prepare For An Aggressive U.S. Fed? Read More »

3 Large-Cap Healthcare Stocks to Buy for Bigger Gains

Despite the uncertain economic conditions and persistent market volatility, the inelastic demand, surging investments, and consistent breakthroughs make healthcare stocks attractive to investors. Growing demand for advanced and viable therapies for chronic and emerging diseases and the aging population should drive the sector’s growth. Investors’ interest in this space is evident from the Vanguard Health

3 Large-Cap Healthcare Stocks to Buy for Bigger Gains Read More »

cut off saw cutting metal with sparks

3 Industrial Stocks to Buy with Strong Growth Potential

Industrial production rebounded strongly with the easing of COVID-19 restrictions. While industrial production advanced at an annual rate of 6.1% during the second quarter, it fell 0.2% in June due to labor shortages, supply chain disruptions, and rising costs. The July Manufacturing PMI declined 0.2 percentage points from the June reading to 52.8%. But this

3 Industrial Stocks to Buy with Strong Growth Potential Read More »

text on shelf

Chart Spotlight: Target Corp. (TGT)

With millions of kids heading back to school in just weeks, investors may want to keep an eye on oversold retailers like Target Corp. (TGT).
Source: MarketClub
Granted, Target hasn’t been popular among investors.
After all, the stock collapsed on an earnings miss. EPS came at $2.19, which was short of expectations. Revenue came at $25.17 billion. Analysts were expecting sales to come in at around $24.49 billion.

“Throughout the quarter, we faced unexpectedly high costs, driven by several factors, resulting in profitability that came in well below our expectations, and where we expect to operate over time,” Target Chief Executive Brian Cornell added.
It’s why the TGT stock plummeted from about $207 to a low of $140.
But the pullback has become overkill, creating a solid opportunity.
Source: MarketClub
For one, according to the MarketClub tools, the intermediate and short-term trends are moving in the right direction. MarketClub is showing green weekly and daily Trade Triangles, which is an indication of further short term upside in the beaten-down retail stock.
Other analysts, such as Wells Fargo’s Edward Kelly, are just as bullish.
Kelly just upgraded TGT stock to overweight from equal weight, with a new price target of $195 a share. Even with negatives, the analyst says the sell-off is overdone, creating “the opportunity to pick up a proven share gainer into an underappreciated earnings recovery at the right price,” as quoted by Barron’s.
The back-to-school season could make the stock even more attractive.
According to K12dive.com, “A 2022 back to school survey from consulting services firm Deloitte shows concerns about inflation are not stopping parents from spending more than last year to get their children ready for the new school year. Although 57% of parents are concerned about inflation’s impact on the cost of school products, 37% plan to spend more than they did last year, the survey found. Deloitte estimates this will result in an 8% annual increase in back-to-school spending, which calculates to $661 per child versus $612 in 2021.”
Target also has a strong history of running during the back-to-school season.

In 2019, for example, TGT ran from about $80 to about $106. In 2020, TGT ran from $118 to $134. In 2021, it ran from about $237 to $263. And while the U.S. economy isn’t doing so hot at the moment, I still believe TGT could see another good run as kids get set for school again.
With MarketClub’s shorter term green Trade Triangles, oversold conditions, bullish analysts, and back-to-school season just weeks away, Target could be a winner.
Ian CooperINO.com Contributor
The above analysis of Target Corp. (TGT) was provided by financial writer Ian Cooper. Ian Cooper is not a Registered Investment Advisor or Financial Planner. This writing is for informational purposes only. It does not constitute an offer to sell, a solicitation to buy, or a recommendation regarding any securities transaction. The information contained in this writing should not be construed as financial or investment advice on any subject matter. Ian Cooper expressly disclaims all liability in respect to actions taken based on any or all of the information on this writing.

Chart Spotlight: Target Corp. (TGT) Read More »