Before the coronavirus pandemic, most of us had never heard of mRNA vaccines, which is not surprising.
Although scientists had been experimenting with the technology for literally decades (reminiscent of fusion), the technology had never progressed beyond the laboratory and into widespread medical use. But now, many of us have been vaccinated against COVID-19 with mRNA vaccines.
However, the gold mine that was COVID vaccine quickly petered out. Here’s what’s next for these biotech companies…
For those of you unfamiliar on how exactly mRNA vaccines, here is a quick description from the Mayo Clinic website:
This type of vaccine uses genetically engineered mRNA to give your cells instructions for how to make the S protein found on the surface of the COVID-19 virus. After vaccination, your muscle cells begin making the S protein pieces and displaying them on cell surfaces. This causes your body to create antibodies. If you later become infected with the COVID-19 virus, these antibodies will fight the virus. After delivering instructions, the mRNA is immediately broken down. It never enters the nucleus of your cells, where your DNA is kept.
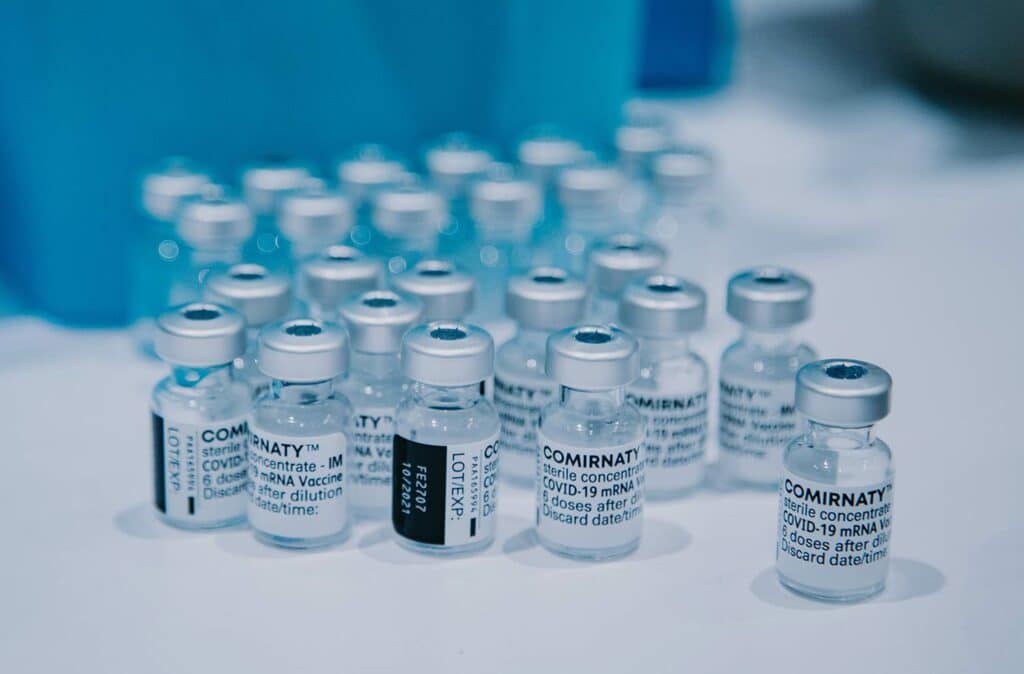
The two most-used mRNA vaccines currently come from Moderna (MRNA) and the joint venture formed by Pfizer (PFE) and BioNTech (BNTX).
After riding high for much of the pandemic, the mRNA vaccine pioneers came down to earth hard in 2022. By mid-June 2022, the stock prices for both Moderna and Germany’s BioNTech had more than halved.
The Next Act for mRNA Technology Companies
But luckily for these companies, mRNA technology is more than a one-trick pony. It’s possible to use mRNA to trigger immune responses to other bodily invaders, including influenza and even cancer.
In fact, an announcement a few weeks ago from Moderna and partner Merck (MRK) has reignited interest in these companies. The two companies—jointly working on this project for six years—published a promising set of melanoma trial results in mid-December. The data released showed that a combination of the Moderna’s experimental cancer vaccine and Merck’s immunotherapy drug, Keytruda, reduced the risk of death or recurrence of melanoma in high-risk patients by 44%, compared with treatment using only Keytruda.
The results sent Moderna stock soaring 27% in the two trading days after their release.
The results emboldened Merck and Moderna to embark on a much larger Phase 3 trial (the Phase 2 trial involved only 157 patients). The companies will also test the combination against other kinds of cancer. “We believe that this should work in many tumor types, not only melanoma,” Moderna CEO Stéphane Bancel said in an interview.
Keep in mind, though, that unlike your typical vaccine, these shots will treat, not prevent, the disease.
In brief, here’s how a cancer vaccine would work: you get the tissue from a patient’s tumor, sequence it, and then, over a six-week period of time, you manufacture a vaccine that matches the top 10 to 20 mutations. The tailor-made vaccine stimulates a person’s immune system to selectively target those cancer cells.
Huge Potential
So, after five decades of failed attempts, cancer vaccines may be set for a breakthrough.
The nearly $17 billion jump in Moderna’s market value over two days following the announcement reflected investors’ hopes that cancer vaccines can work and become as common as the company’s mRNA vaccines.
Analysts from Jeffries say that the later-stage melanoma treatment market could be worth up to $5 billion (or between $9 and $15 per share in earnings) to Moderna. That figure may turn out to be far too conservative if mRNA vaccine technology works against other types of tumors.
Of course, there is no guarantee that the next phase of the Moderna/Merck clinical trials will be as encouraging as the last. And, even if the vaccine does work against melanoma, can the results be duplicated when tried against other types of cancers?
I think it can. Targeting multiple antigens decreases the odds that cancer cells will mutate in ways that make the vaccine useless, because the immune system will be attacking on multiple fronts. That makes personalized vaccines a great fit for fast-mutating cancers.
But we shall find out for sure in the years ahead.
Meanwhile, here’s how I look at both Moderna and BioNTech, which is working on its own half dozen or so cancer vaccines with companies like Regeneron Pharmaceuticals (REGN).
While many innovative biotech companies are struggling to raise funds, a successful coronavirus vaccine has left Moderna with roughly $7 billion of net cash. BioNTech has double that amount. The companies can now apply both their cash and the knowhow they gained during the pandemic to other urgent medical needs like cancer treatments.
Neither company is a low-risk investment. However, both Moderna and BioNTech look cheap when you consider the potential for cancer vaccines. Both Moderna around $175 a share and BioNTech at about $150 a share seem like reasonable bets.
It’s not REITs or blue chips like Disney. A small, little-talked about area of the dividend stock market is pumping out market-beating returns like no tomorrow. Over 22 years, they’ve handily beat the market… and I have the #1 stock of these to give you now.