

It’s time to update the S&P 500 index chart as it emerged inch-perfect since the last update in July.
To refresh your memory, I kept the main paths untouched and added new crucial highlights.
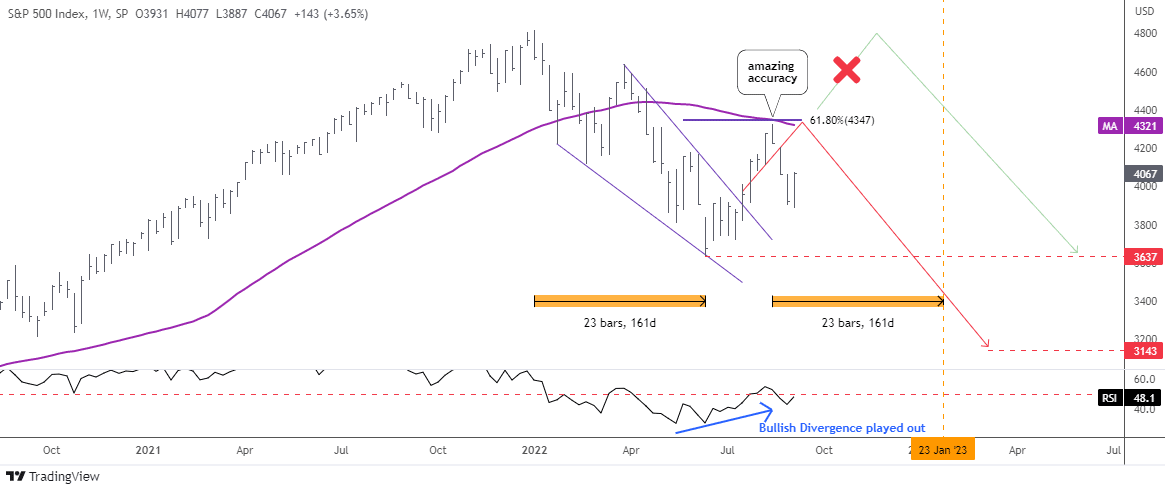
The idea of the upcoming breakout of the Falling Wedge pattern (blue converging trendlines) was posted right on time on the Blog as it played out instantly. Indeed, the Bullish Divergence of the RSI indicator with the price chart played out as planned supporting the breakup of the pattern’s resistance.
The majority of readers got it right choosing the red path as a primary scenario. The price action has been amazingly accurate in the 61.8% Fibonacci retracement area where the price failed to overcome the barrier and reversed to the downside from the minor top of $4,325 following the red zigzag.
I added the 52-week simple moving average (purple) to show you how strong the double resistance was at the $4,347-$4,349 level.
The next support is located in the valley in June at $3,637.
After the minor top has been established, we can make a calculated projection of the downside target. It is located at $3,143, where the current leg down would travel the same distance as the previous leg down.
This time, I also added the time target (orange) based on the earlier move, which took 23 bars to unfold. It falls on the end of January 2023. The Fed might take a break lifting the interest rate then. More often than not the time it takes second leg to emerge doesn’t match with the initial move. However, it is still good to have this benchmark.
The $4,325 mark has turned to be a resistance now as the index could still build a more complex structure to the upside reviving the green path.
Now let me reveal the reason behind the title of this post in the next chart.
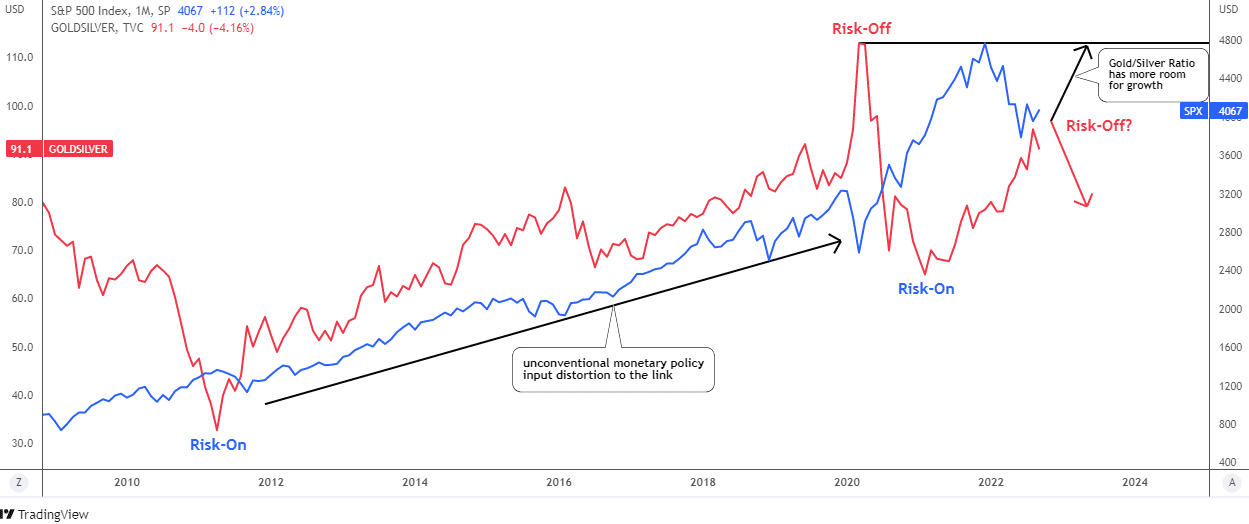
This is this comparison chart of the gold/silver ratio (red) and the S&P 500 index (blue). The idea is simple; the red line shows the risk-off mode when it moves up as safe-haven gold becomes more valuable than the industrial silver. The risk-on mode is active in the opposite direction and the S&P 500 index starts to grow.
There is a long period of unconventional monetary policy that interrupted the link when both gold/silver ratio and the index has been growing. However, we could still distinct several local areas where this opposite correlation works very well in spite of the large uptrend. Since 2020, this link is back to normal with visible crossovers and opposite extremes.
The S&P 500 index is clearly on the edge now as it has been very close to crossing the red line down lately.
We can see that the gold/silver ratio has a lot of room for further growth to retest the all-time high of 113 oz. It could be a 24% rise of the ratio.
The risk-off mode would reach its climax then putting a huge pressure on the stock market. The relevant drop of 24% in the S&P 500 could hit the $3,090 mark, which coincides with the downside target calculated in the first chart of the index above.
Intelligent trades!
Aibek Burabayev
INO.com Contributor
Disclosure: This contributor has no positions in any stocks mentioned in this article. This article is the opinion of the contributor themselves. The above is a matter of opinion provided for general information purposes only and is not intended as investment advice. This contributor is not receiving compensation (other than from INO.com) for their opinion.
