×

It’s not goodbye, it’s hello Magnifi!

You are now leaving a Magnifi Communities’ website and are going to a website that is not operated by Magnifi Communities. This website is operated by Magnifi LLC, an SEC registered investment adviser affiliated with Magnifi Communities.

Magnifi Communities does not endorse this website, its sponsor, or any of the policies, activities, products, or services offered on the site. We are not responsible for the content or availability of linked site.

Take Me To Magnifi

INO.com

See Mentor in Action and Get 50% Off

Join Magnifi Tuesday, Wednesday, or Thursday this week and see how Mentor can help you build a financial portfolio and take your investing to the next level.
What you’ll see from Mentor:

How to build your financial portfolio
Understanding personalized portfolio updates
Analysis and market alerts
Q&A: Answering the most common Mentor questions

And you can still lock in Mentor for $7 / month – this offer will be expiring soon!

Tuesday 4:00PM ET / 1:00PM PT
See how Mentor’s personalized portfolio alerts and interactive charts and graphs help you understand your portfolio.

Wednesday 2:00PM ET / 11:00AM PDT
Learn how Mentor helps you identify stocks and ETFs you’d like to invest in—with no account minimums or commissions.

Thursday 12:00PM ET / 9:00AM PT
Mentor can steer you through portfolio design based on your investing needs.

MarketClub/INO, a division of TIFIN Group LLC, is affiliated with Magnifi via common ownership. Affiliates of Magnifi will receive cash compensation for referrals of clients who open accounts with Magnifi. Due to this compensation, a conflict of interest exists since MarketClub/INO has an incentive to recommend Magnifi LLC.
Magnifi LLC does not charge advisory fees or transaction fees for non-managed accounts. Clients who elect to have Magnifi LLC manage all or a portion of their account will be charged an advisory fee. Please see Magnifi’s Form ADV for additional information about fees and charges that may apply. Magnifi LLC receives compensation from product sponsors related to recommendations. Other fees and charges may apply.
Normally $14 per month, Mentor will be $7 per month for the first 10,000 users.
This material is provided for informational purposes only and should not be construed as individualized investment advice or an offer or solicitation to buy or sell securities tailored to your needs. Investors should carefully consider the investment objectives and risks as well as charges and expenses of all securities before investing. Read the prospectus carefully before investing. Advisory services are offered through Magnifi LLC, an SEC Registered Investment Advisor. Being registered as an investment adviser does not imply a certain level of skill or training. The information contained herein should in no way be construed or interpreted as a solicitation to sell or offer to sell advisory services to any residents of any State where notice-filed or otherwise legally permitted. All content is for information purposes only. It is not intended to provide any tax or legal advice or provide the basis for any financial decisions. Nor is it intended to be a projection of current or future performance or indication of future results. Moreover, this material has been derived from sources believed to be reliable but is not guaranteed as to accuracy and completeness and does not purport to be a complete analysis of the materials discussed. Purchases are subject to suitability. This requires a review of an investor’s objective, risk tolerance, and time horizons. Investing always involves risk and possible loss of capital.

See Mentor in Action and Get 50% Off Read More »

Crude Oil Closes the Gap

Back in July, I shared with you a chart of Market Distortion where I put together crude oil and platinum futures. I spotted a disruption of a strong correlation pattern between these two instruments that has been lasting for a quarter of a century.
That post drew your attention with strong support and feedback as readers shared their valuable comments. Below is the graph showing the distribution of your opinion on how the divergence would play out.

The majority of readers chose the option that implies the equal move in the opposite direction of both instruments to meet somewhere in between – crude oil should drop to $75 and platinum futures should rocket to $1,200. The second largest bet was on the widening gap.

I prepared for you an updated chart below to see what happened after two months.
Source: TradingView
None of the bets have hit it right, although your main choice is still the closest. Indeed, the crude oil futures (black line) did its job fully to close the gap as it almost touched the $75 area. The lowest handle hit was $78 so far.
The counterpart, as it often happens in human relationships, did not meet the other part halfway. The platinum (green line) is still weak as it can’t raise its head to the upside.
Should crude oil do the job for both and drop even lower like a rock to catch up with the metal? Or is platinum quietly accumulating power for a rally?
Let us check the latter in the weekly chart of platinum futures below.
Source: TradingView
I zoomed in on the big map of platinum futures posted in July to focus on the pullback that is still in progress as we didn’t see the touchdown on the black support. I contoured it with the red downtrend channel. The downside of the channel hasn’t been hit as well.
I put the question mark on the second red leg down as it has yet to travel the distance of the first leg down. However, the main criteria of a lowest valley has already been met as the minimum price of $797 was $10 down compared to the previous valley. This gives hope for a reversal that failed earlier in the summer.

So far, the price has failed to overcome the double barrier on its way to the upside both last month and this month. That resistance consists of a 52-week simple moving average (purple) at $966 and the mid-channel (red dashed) around $940. The chance for reversal is still there as long as the price is above the current growth point (black dashed) of $797.
The RSI couldn’t break up during two attempts either. It should cross the “waterline” of 50 to the upside to support the potential rally.
The upside of the red channel is the next resistance around $1,200, right where crude oil has been waiting for it.

 Loading …
Intelligent trades!
Aibek BurabayevINO.com Contributor
Disclosure: This contributor has no positions in any stocks mentioned in this article. This article is the opinion of the contributor themselves. The above is a matter of opinion provided for general information purposes only and is not intended as investment advice. This contributor is not receiving compensation (other than from INO.com) for their opinion.

Crude Oil Closes the Gap Read More »

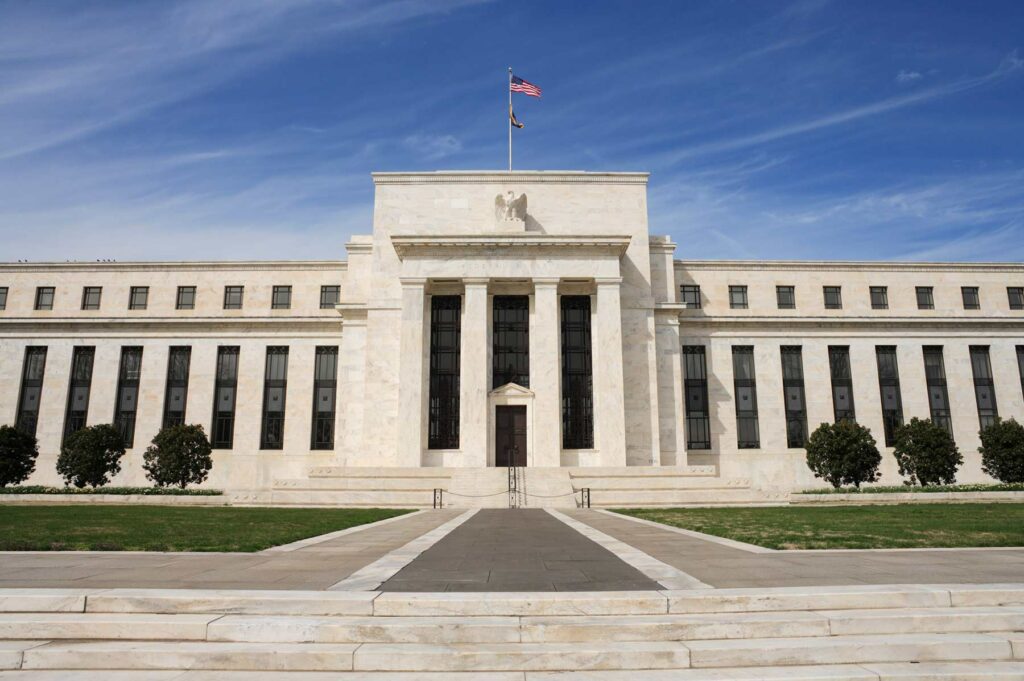
The Fed Kicks It Up a Notch

A long, long time ago — 1992 to be specific — the American media howled with derision when then President George H.W. Bush professed “amazement” at a new supermarket bar code scanner, the coverage of which was supposed to demonstrate that Bush was hopelessly out of touch with the daily lives of ordinary Americans.
To its credit, the Associated Press a few days later tried to correct that impression, but by then the rest of the press had moved on and the falsehood has lived on ever since.
Bush’s supposed gaffe at least had no policy ramifications, although the story didn’t help his reelection efforts that year.
The same can’t be said about President Biden’s absurd comments to 60 Minutes last Sunday that inflation is now under control, albeit at more than 8%, the highest sustained level in more than 30 years.

After dismissing August’s monthly CPI reading as “up just an inch, hardly at all,” he proceeded to gladly dig himself even deeper, proudly telling the interviewer Scott Pelley that “we’re in a position where for the last several months, it [inflation] hasn’t spiked, it’s been basically even.”
In other words, inflation hasn’t risen to 9% or 10% year-on-year, so we’re in good shape.
This comes on top of other whoppers he and other members of his administration have said over the past several months, such as telling us that the recent student loan giveaway and an earlier deficit-raising budget measure were all already “paid for,” as if there was no cost involved.
Not to mention labeling his most recent budgetary measure the “Inflation Reduction Act.” Talk about Newspeak.
The point here is to demonstrate just how hard Federal Reserve Chair Jerome Powell‘s job is going to be to try to bring down inflation — yes, Mr. President, it’s really high and not getting lower — without any help from the fiscal authorities led by the White House. So brace yourselves for more interest rate increases.
During the Great Recession and global financial crisis of 2008 and the 2020 pandemic, the fiscal and monetary authorities worked closely together to try to get the American people and economy through with as little pain as possible. Congress and the White House threw massive amounts of money at the problems, while the Fed paid a big part of the bill by buying up an enormous chunk of the U.S. Treasury and mortgage bond markets.
Now that these crises are pretty much over, with inflation as the hangover, government policy needs to move to a tighter monetary policy and a more restrained fiscal policy.
Unfortunately, only one of those authorities seems to have got the message. It’s like a married couple with opposite views of their family budget—one spouse feels the need to tighten their belts, while the other just keeps spending as much as they ever did. That’s usually a marriage headed for big trouble.
Unfortunately, consumers and investors will have to deal with the repercussions, consumers with higher prices for just about everything and investors with lower and likely deeper negative returns. It would certainly be a lot easier and quicker to resolve these post-crisis problems if both fiscal and monetary authorities acted together to try to cure inflation and get the country back to normal, but that doesn’t seem to be in the cards.
Not surprisingly, then, the Fed pretty much had no choice but to raise its benchmark interest rate another 75 basis points at its meeting on Wednesday, to a range between 3.0% and 3.25%, the highest rate since before the 2008 crisis, while signaling another 125 basis points in rate hikes at its two remaining meetings this year (early November and mid-December).
That would put the federal funds rate at 4.25% to 4.5% before the end of the year. By comparison, the fed funds rate stood at 0% as recently as March.
Since the one raising rates is the Fed, it gets the lion’s share of the blame for the resulting drop in stock and bond prices from angry investors. And it certainly deserves its share of the blame, since it allowed its easy money policies to go on way too long.

If it had been a little more proactive, like starting to raise rates last year — maybe even before that — the pain that Powell now speaks about that consumers and investors will need to suffer through might be a little less acute and a soft economic landing might have been achievable.
But that ship looks like it might have already sailed, and we may be heading into rougher economic waters than we otherwise might have.
Yet the folks on the fiscal side, namely the White House and Congress, have gotten off basically scot-free for their role in pumping up inflation and doing nothing to try to stifle it.
Biden’s out-to-lunch comments to 60 Minutes might indicate that investors and consumers shouldn’t even bother to expect anything better from them. Which means the Fed’s rate-hiking policy will need to be even more aggressive going forward.
Don’t be surprised if the fed funds range has a 5 handle sometime early next year.
George YacikINO.com Contributor
Disclosure: This article is the opinion of the contributor themselves. The above is a matter of opinion provided for general information purposes only and is not intended as investment advice. This contributor is not receiving compensation (other than from INO.com) for their opinion.

The Fed Kicks It Up a Notch Read More »

Apple Just Entered the Space Race

Over the past few years, many big technology companies have entered the space race, whether it was Amazon’s (AMZN) Jeff Bezos with Blue Horizon, Tesla’s (TSLA) Elon Musk with Space X, or Alphabet’s (GOOG) satellite internet service, which will be competing with Space X Starlink internet service.
Now the newest technology company to enter space is Apple (AAPL), but in a slightly different way than the others.
On September 7th, Apple released its newest iPhone, the iPhone 14. One of the key features of this new device is the Emergency SOS via satellite feature. This feature allows iPhone 14 owners to contact emergency services via satellites in an emergency when the individual does not have traditional cellular telephone service.
This feature could be a game changer during natural disasters and cell towers are knocked out. Those in need of help will be able to contact first responders with their location, health status, and other pertinent information to help save lives.

Apple is subcontracting the satellite service with a company called Globalstar (GSAT) which already has a network of satellites in outer space for which Apple iPhone 14 and newer phones will be able to access.
The Emergency SOS satellite service will be free for the first two years of owning the iPhone 14; after that time, there will be a price associated with the service, but those details are unknown now.
With more and more of the major technology companies entering space in some form or fashion, it is not hard to see that aerospace technology and the companies currently operating in that industry will benefit from the shift.
That is why I believe you should consider investing a small portion of your portfolio in the aerospace industry. And one of the best ways to gain broad access to any sector is using exchange-traded funds. So, let us look at a few ETFs you can own today, which will give you access to the aerospace industry.
First is the largest and most well-known of the three I will highlight today, the ARK Space Exploration & Innovation ETF (ARKX). ARKX is one of Cathie Woods funds. ARKX focuses on global companies engaged in space exploration and innovation.
As described by the fund advisor, space exploration is leading, enabling, or benefiting from technologically enabled products and /or services that occur beyond the surface of Earth and the introduction of a technologically enabled product or service that the advisor expects to change an industry landscape.
The fund’s scope seems broad, but ARKX only has 36 holdings with a weighted average market cap of $82 billion. The fund currently has $293 million in assets and charges an expense ratio of 0.75%. ARKX had an inception date of March 30th, 2021.
Next, we have the Procure Space ETF (UFO). UFO was the first global aerospace and defense fund, founded in April 2019. It focuses on companies that span several industries, including satellite-based consumer products and services, rocket and satellite manufacturing, deployment and maintenance, space technology hardware, ground equipment manufacturing, and space-based imagery and intelligence services. 
UFO has 47 holdings with a weighted market cap of $25 billion and charges an expense ratio of 0.75%, the same as ARKX. UFO has $60.8 million in assets under management.

And finally, the SPDR S&P Kensho Final Frontiers ETF (ROKT). This ETF has been around since October 2018 but differs from UFO because it focuses more on US-based companies whose products and services drive the innovation behind exploring deep space and the deep sea. 
ROKT has 36 holdings with a weighted market cap of $31 billion and an expense ratio of 0.45%, making it the cheapest of the three ETFs highlighted today.
Year-to-date, all three funds are in the red. ROKT is down 8.5%, while ARKX and UFO are down 27.75% and 25.2%, respectively. But, the whole market is off this year, so I wouldn’t trust these ETFs to stay red over the long run.
Furthermore, as we have seen the progression of technology and outer space collide, with the most recent by Apple, I believe it is hard to deny that more and more companies will make a similar move. In the future, we will have more companies operating in the aerospace industry or the space industry providing them a service, such as internet or cell service. Obviously, that will drive the industry and make any investments you make today much more valuable in the future.
Matt ThalmanINO.com ContributorFollow me on Twitter @mthalman5513
Disclosure: This contributor did not hold a position in any investment mentioned above at the time this blog post was published. This article is the opinion of the contributor themselves. The above is a matter of opinion provided for general information purposes only and is not intended as investment advice. This contributor is not receiving compensation (other than from INO.com) for their opinion.

Apple Just Entered the Space Race Read More »

September FOMC Meeting – How Might Gold Respond

The Federal Reserve will conclude its September FOMC meeting and release a written statement at 2 PM EDT today. This will be followed by Chairman Powell’s press conference a half-hour later.
It is widely anticipated that the Federal Reserve will raise the “Fed funds rate” by 75 basis points. The CME’s FedWatch tool is forecasting that there is an 84% probability of a 75-basis point hike, and a 16% probability that the Fed will raise rates by a full percentage point.
In the unlikely event that the Federal Reserve raises its benchmark interest rate by 1%, it would most certainly pressure gold to lower pricing.

According to MarketWatch, “economists at the brokerage Nomura Securities … became the first on Wall Street to predict a full-percentage-point increase in the Fed’s benchmark short-term rate.”

However, if the Fed raises rates by 75 basis points as expected market participants could see some short-covering activity amid a relief rally. As of 5:05 PM EDT yesterday gold futures basis, the most active December contract is trading five dollars lower and is fixed at $1673.20.
The hard truth is that after four consecutive rate hikes beginning in March inflation remains extremely elevated and persistent. The latest data revealed that the CPI index had a slight decline from July’s 8.5% to 8.3% in August. While the headline CPI had a fractional decline the core CPI which strips out food and energy costs increased 0.6% more than double the prior month’s increase. This means that the core inflation rate climbed to 6.3% from 5.9% in August.
Because the August core inflation rate is three times the 2% target the Federal Reserve wants to achieve members of the Federal Reserve will continue the exceedingly hawkish tone expressed at the Jackson Hole economic symposium.
Based on the hot and persistent core inflation participants can expect to see interest rates continue to rise during the remaining three FOMC meetings in September, November, and December. The CME’s FedWatch tool is forecasting that there is a 38.9% probability that the Fed will raise rates to between 400 and 425 basis points and a 44.8% probability that rates will be between 425 and 450 basis points by December 2022.

Interest rate hikes that began in March were the primary fundamental events that resulted in a major price decline in gold. After four consecutive interest rate hikes gold has declined by approximately 19% or $400 per ounce.
In his speech last month Jerome Powell acknowledged the severe fallout of reducing inflation. “The Fed’s drive to curb inflation by aggressively raising interest rates would bring some pain.”
For those who would like more information simply use this link.
Wishing you as always good trading and good health,Gary S. WagnerThe Gold Forecast

September FOMC Meeting – How Might Gold Respond Read More »

3 Meme Stocks to Avoid

Meme stocks witness unusual rallies solely based on retail investors’ interest in them. Retail investors gather on social media platforms such as Reddit, Stocktwits, Twitter, and Facebook and bet on fundamentally weak stocks to trigger a short squeeze. As the skyrocketing rallies in these stocks have little to do with the fundamentals of the companies, they fail to sustain the high price levels they reach.
The meme stock mania, born during the peak of the COVID-19 pandemic, has recently returned after a pause for a few months, as evident from unusual rallies of certain fundamentally weak stocks. Since the surge in meme stocks is usually disconnected from the companies’ fundamentals, investors should shun them amid an uncertain market outlook.
The Consumer Price Index (CPI) for August rose 8.3% year-over-year. And the rampant inflation enhances the chances of the Federal Reserve maintaining its hawkish stance, pushing an already weakening economy into a recession. Thus, the stock market is expected to remain under pressure in the foreseeable future. This is a good enough reason to avoid the risk associated with meme stocks.
Hence, fundamentally weak meme stocks Robinhood Markets, Inc. (HOOD), AMC Entertainment Holdings, Inc. (AMC), and Bed Bath & Beyond Inc. (BBBY) are likely best avoided now.
Robinhood Markets, Inc. (HOOD)
HOOD operates a financial services platform in the United States. The company’s platform enables users to invest in stocks, exchange-traded funds (ETFs), gold, options, and cryptocurrencies. In addition, it provides learning and education solutions, including Snacks for business news stories, News Feeds that give access to free premium news from different sites, and first trade recommendations.

In August, HOOD announced its second round of layoffs this year, slashing 23% of its headcount by letting go of 800 employees, with marketing, operations, and product management functions of the firm being the most impacted. The company blamed the worsening of the economy, including inflation and the crypto market crash, which had reduced customer trading activity and assets under custody.
Financial services companies are also struggling with a shrinking active user base and increasing regulatory pressure. The monthly active users (MAU) declined 1.9% million sequentially to 14 million for June 2022, as consumers navigate an environment marked by high-interest rates and surging inflation.
For the fiscal 2022 second quarter ended June 30, 2022, HOOD’s revenues decreased 43.7% year-over-year to $318 million. Its operating expenses increased 21.8% from the year-ago value to $610 million. The company’s adjusted EBITDA was negative $80 million, compared to $90 million in the prior-year period.
In addition, the company’s net loss and loss per share attributable to common stockholders amounted to $295 million and $0.34, respectively.
The consensus revenue estimate of $353.60 million for the fiscal year 2022 (ending December 2022) represents a 24.7% decline from the prior-year period. The company’s loss per share is expected to come in at $1.14 for the current year. Furthermore, the company has missed the consensus revenue estimates in each of the trailing four quarters.
HOOD’s shares have slumped 21.4% over the past six months and 44.4% year-to-date to close the trading session at $10.26.
HOOD’s POWR Ratings are consistent with this bleak outlook. The company’s overall F rating translates to a Strong Sell in this proprietary rating system. The POWR Ratings assess stocks by 118 different factors, each with its own weighting.
HOOD has an F grade for Quality. It has a D grade for Value, Stability, and Sentiment. It is ranked #141 of 152 stocks in the F-rated Software – Application industry. Click here to learn more about POWR Ratings.
AMC Entertainment Holdings, Inc. (AMC)
AMC is a leading theatrical exhibition company that delivers distinctive and movie-going experiences. The company owns, operates, and has interests in theaters in the United States and internationally. It owns and operates more than 950 theaters and 10,600 screens.
In August, Cineworld Group, the second-largest British theater company in the world which owns Regal Cinemas, released a statement to the London stock exchange, stating that its liquidity is in doubt amid a disappointing moviegoing recovery from pandemic lows. Then, in the same month, the Wall Street Journal reported that the theater company was preparing to file for bankruptcy within weeks.
The news of Cineworld, AMC’s closest rival, filing for bankruptcy alarmed its shareholders because of the terrible industry dynamics.
AMC’s operating costs and expenses increased 59.5% year-over-year to $1.18 billion in the fiscal 2022 second quarter ended June 30, 2022. The company’s operating loss and net loss amounted to $16.10 million and $121.60 million, respectively. AMC’s adjusted loss per share came in at $0.20 for the second quarter.
Analysts expect AMC’s loss per share for the fiscal 2022 fourth quarter (ending December 2022) to worsen 138.6% year-over-year to $0.26. Also, the company’s loss per share for the current and next year is expected to come in at $1.10 and $0.54, respectively. The company has missed the consensus EPS estimates in each of the trailing four quarters.
The stock has plunged 49.6% over the past month and 65.4% year-to-date to close the last trading session at $9.18.
AMC’s POWR Ratings reflect this poor outlook. The stock’s overall D rating equates to a Sell in this proprietary rating system. AMC has an F grade for Stability and Sentiment.
Within the F-rated Entertainment-Movies/Studios industry, it is ranked #6 of 7 stocks. Click here to learn more about POWR Ratings.
Bed Bath & Beyond Inc. (BBBY)
BBBY operates a chain of retail stores. The company sells a range of domestic merchandise, home furnishings, and other juvenile products. The company owns more than 953 stores and offers its products through various websites and applications comprising bedbathandbeyond.com, bedbathandbeyond.ca, facevalues.com, buybuybaby.ca, and decorist.com.
BBBY’s Interim Chief Executive Officer, Sue Gove, stated, “In the quarter, there was an acute shift in customer sentiment, and since then, pressures have materially escalated. This includes steep inflation and fluctuations in purchasing patterns, leading to significant dislocation in our sales and inventory.”
In the fiscal 2023 first quarter ended May 28, 2022, BBBY’s net sales decreased 25.1% year-over-year to $1.46 billion, and its gross profit declined 44.9% from the year-ago value to $349.31 million. Its operating loss widened 371.9% year-over-year to $339.16 million. Its adjusted EBITDA loss amounted to $223.54 million, compared to an $86.07 million EBITDA reported in the prior-year period.

Furthermore, the company’s net loss and loss per share came in at $357.67 million and $4.49, widening 603% and 835.4% year-over-year, respectively.
Analysts expect revenues to decline 21.9% year-over-year to 1.47 billion in the fiscal 2022 third quarter (ending November 2022). The $1.49 consensus loss per share estimate for the ongoing quarter indicates a 496.2% worsening from the prior-year period.
Also, the company’s revenue and EPS for the current year (ending February 2023) are expected to decline by 22.3% and 539.3% year-over-year, respectively.
It’s no surprise that BBBY has an overall rating of D, which translates to Sell in the POWR Ratings system. It has a grade of F for Stability and Sentiment and a D for Growth and Momentum.
BBBY is ranked #58 among 62 stocks in the Home Improvement & Goods industry. Click here to learn more about POWR Ratings.

About the Author
Mangeet Kaur Bouns’ keen interest in the stock market led her to become an investment researcher and financial journalist. Using her fundamental approach to analyzing stocks, Mangeet’s looks to help retail investors understand the underlying factors before making investment decisions. She earned a bachelor’s degree in finance from BI Norwegian Business School. Mangeet is a regular contributor for StockNews.com.

3 Meme Stocks to Avoid Read More »

Where do you think USDJPY will go?

The Japanese yen is the second largest component of the Dollar Index (DX). It occupies 13.6% of it.
The real interest rate differential is the main reason behind the current severe weakness of the yen. I have already visualized it for you in my earlier post in August.
The Bank of England (GBP, 3rd largest part of DX) and lately the European Central Bank (EUR, the largest component of DX) raised their interest rates significantly during the last meetings. The Bank of Japan (BOJ), the Japanese Central Bank has kept its negative rate of -0.1% since 2016. Moreover, it repeated that it would not hesitate to take extra easing measures if needed, falling out of a global wave of central banks tightening policy.
Why BOJ is so dovish? There are several reasons. One of them, the history of inflation as shown in the chart below.
Source: TradingView
Japan has had a chronic deflation since the 1990s after the asset bubble burst. We can see how short term spikes of inflation (orange line) into the positive territory were short-lived. The BOJ didn’t even touch the interest rate in spite of inflation that has soared to unseen levels of 3.7% in 2014. This time around, the inflation didn’t race to the same peak and as I wrote above, the BOJ thinks of an opposite – easing!

The BOJ governor Mr. Kuroda said in the summer “If we raise interest rates, the economy will move into a negative direction.” The Japanese Central Bank does not want to cause a recession as the economy is still fragile.
Maybe the next chart could clarify the logic of the BOJ.

The land of the rising sun has hoarded the giant government debt from circa 56% of nominal GDP in 1994 up to the current 231%. This indicator in the U.S. stands close to 140%. From this perspective, rising interest rates means growing expenses to serve the debt. This could demotivate the tightening.
Now, let us move to the comparison of the FX chart with the real interest rate differential.
Source: TradingView
The USDJPY (blue bars) accelerated higher with the rising real interest rate differential (red line) this year.
The Fed is not afraid to throw the U.S. economy into a recession, but the BOJ is, so the former makes unprecedented hikes of the interest rate. The next Fed move is expected this week and the only question is +0.75% or +1%.
I added an orange box on the chart to highlight the area where the negative gap will shrink from the current -3.1%. It could hit either -2.45% or -2.10%. This could charge another rally of the US dollar against the Japanese yen towards ¥150 per $1 and beyond.
I would like to complete the picture with the technical chart below.
Source: TradingView
The yen chart is just beautiful. The USDJPY is usually one of the clearest in terms of the structure among foreign exchange pairs.

Since 2011, we can highlight two large moves to the upside. The first move, marked as a blue AB segment, was completed in 2015. The following BC consolidation has emerged in the form of a Triangular Consolidation (purple trendlines). It took the market almost six years to shape this large structure, longer than the preceding AB move. This again confirms the tricky nature of corrections and its time consuming ability.
We are on the CD move now. It has a sharp angle, though it could last longer. This part will travel the same distance as the first move when it will reach ¥152.89. The yen should weaken 7% in this case. The next target is located at the 1.272x of AB segment at ¥166.56, which equals to 16.6% of dollar gain.
The nearest support is located in the valley of the preceding correction in ¥130. The 52-week simple moving average is located lower at ¥123.48. Both supports are too far, as the trend is sharp.

 Loading …
Intelligent trades!
Aibek BurabayevINO.com Contributor
Disclosure: This contributor has no positions in any stocks mentioned in this article. This article is the opinion of the contributor themselves. The above is a matter of opinion provided for general information purposes only and is not intended as investment advice. This contributor is not receiving compensation (other than from INO.com) for their opinion.

Where do you think USDJPY will go? Read More »

AstraZeneca’s (AZN) Blockbuster Drug Pipeline

Finding winners in the pharmaceutical sector is not an easy process. But it is potentially quite lucrative.
For the pharmaceutical companies themselves, the current environment for success is reminiscent of the Greek myth surrounding Sisyphus, whom the gods condemned to repeatedly roll a boulder up a hill—only to have it roll down again once he got it to the top—for all eternity.
Today’s pharmaceutical firms must use vast amounts of capital in search of a blockbuster drug, which can generate $1 billion or more in annual sales. But then, even when such a medicine is found, the benefits provided are fleeting: from the moment a drug makes it to market, the clock begins ticking on its patent exclusivity. Once this expires and generic copycats reach the market—typically within a decade or so—revenues for the original inevitably fall, and often quite rapidly.
Then, like Sisyphus, the companies climb the hill of developing blockbuster drugs again, investing anew in the whole risky and costly process of drug development.
If you are an investor in the sector, you want to focus on the companies that have drugs in their pipelines with blockbuster potential, as well as the funds necessary to propel them through several trial stages.

Since 2010, the global pharmaceutical sector has invested the equivalent of around one quarter of its revenues in drug development each year. The U.S. industry alone spent some $83 billion on R&D in 2019—when adjusted for inflation, that’s about 10 times what it spent in the 1980s!
So, which segments of the pharmaceutical industry (and which drug companies) are poised to come up with the next blockbuster drugs?
Precision Therapies
Recent advances in science are ushering in a new era of highly effective personalized medicines. So-called precision therapies are based on greater understanding of how diseases work on a molecular level. This translates to doctors being able to identify what treatments fit which patients, and why.
Precision therapies are tailored to fit specific groups of people. This means they will likely be highly effective. But can cutting-edge personalized medicines reach blockbuster drug status? The naysayers say the market size is too small…but they seem to forget that innovative drugs can command very high price tags.
Consider recent data from the drug price tracking service division of GoodRX (GDRX). It shows that, after 15 years on the market, the average drug with accelerated approval by the FDA underwent 15.4 price increases. Drugs subject to conventional approval saw 12.7 price increases in the same span of time.
Keeping an eye on the list of development-stage therapies expedited through the FDA’s approval processes can provide insight into which companies have potential blockbusters in the pipeline.
AstraZeneca (AZN)
One company that fits that profile is AstraZeneca (AZN), and here’s why it is so interesting…
The company specializes in one of the areas where personalized medicine is making great strides: oncology. It already has three blockbuster cancer drugs. Per Morningstar:
Overall, the company looks well positioned for growth with the recently launched cancer drugs carrying strong pricing power that should have an amplified impact on the bottom line. We expect the first-line lung cancer indication for Tagrisso combined with the likely gains in adjuvant lung cancer will drive peak sales above $9 billion annually. Also, cancer drug Imfinzi should gain share in Stage III lung cancer where treatment options are limited and the drug holds growing potential in other cancers. Additionally, BRCA-focused cancer drug Lynparza is well positioned to gain further market share in new indications.
And now, one of the company’s other treatments, Enhertu, is viewed by some as the next big thing. It has been granted five separate breakthrough therapy designations by the FDA: three for hard-to-treat types of breast cancer, and one designation each for lung and gastric cancers.
Enhertu is an antibody drug conjugate (ADC), a type of therapy that is designed to do minimal damage to healthy, non-cancerous cells. It works by attacking tumors that test positive for a protein called HER2, which is associated with worse disease outcomes.

Known as “biological missiles.” ADCs are part of the new generation of personalized cancer treatments that target tumors with specific features, or biomarkers. Some 12 ADCs have received regulatory approval to date, while more than 100 others are in various stages of development.
Wall Street analysts believe that Enhertu has the potential to become a key growth driver for AstraZeneca. Consensus estimates are that sales could reach $4.5 billion by 2026, up from a negligible level now.
AstraZeneca’s Bright Future
The company had a relatively late start on emerging from the industry patent cliff that largely started in 2012. But today, AstraZeneca’s strong lineup of next-generation drugs should easily offset sales lost to new generic competition.
Morningstar says: “…we project the majority of new drug sales will be supported in therapeutic areas with strong pricing power with a heavy focus on differentiated oncology drugs Tagrisso and Imfinzi, Lynparza and Calquence.”
Annual sales growth over the next five years should in the 8% to 10% range as new products offset patent losses. Profit margins will expand too as high margin personalized drugs, particularly in oncology, will represent a larger proportion of overall sales over the next five years.
The stock is a buy anywhere in the $60 to $65 range.
Read More from Investors Alley

About the Author
Tony Daltorio is a seasoned veteran of nearly all aspects of investing. From running his own advisory services to developing education materials to working with investors directly to help them achieve their long-term financial goals. Tony styles his investment strategy after on of the all-time best investors, Sir John Templeton, in that he always looks for growth, but at a reasonable price. Tony is a regular contributor for InvestorsAlley.com.

AstraZeneca’s (AZN) Blockbuster Drug Pipeline Read More »

wine glass on restaurant table

2 Restaurant Stocks In Undervalued Territory

It’s been a challenging year thus far for the restaurant industry, with dollars typically allocated to entertainment and a Friday night out wrestling to steal priority from rising gas bills, elevated energy costs, and higher mortgage rates.
Some restaurants have resorted to discounting to drive traffic, while others have relied on menu innovation and limited-time offers vs. promotional activities to protect their already softening margins.
(Source: Twitter, ND Wealth Management, Steve Deppe)
Those brands that are the most out of touch have continued to raise prices at a double-digit pace to ensure they maintain margins, with Chipotle (CMG) being one such offender. While this is likely to protect margins in the interim and allow the company to meet earnings estimates, it could backfire over the medium-term, with loyal customers feeling taken advantage of after being hit with consistent menu price increases in a recessionary environment.
Although this has made it difficult to invest in the sector, a few names are doing a great job navigating the current environment, and following recent share price weakness, they’ve slipped into undervalued territory.

One is a new breakfast chain that’s bucking the negative traffic trends in the casual dining space and enjoying industry-leading retention due to a key competitive advantage. The other is a pizza chain that’s enjoying strong unit growth, and while it’s having a tough year, annual EPS is forecasted to hit new all-time highs in FY2023 and FY2024.
Let’s take a look below:
First Watch Restaurant Group (FWRG)
First Watch Restaurant Group (FWRG) is a brand with over 450 restaurants serving breakfast in the United States, with a unique model being open from just 7 AM to 2:30 PM.
This has allowed the company to evade the industry-wide staffing issues, with its team members able to maintain a work-life balance, which isn’t possible for most restaurant brands.
In addition to solid staffing metrics that led the industry average, the company released blowout results in Q2, reporting traffic growth of 8.1% vs. an industry that saw negative 4% traffic in the quarter.
This translated to 20% system-wide sales growth ($231.2MM) and 13.4% same-restaurant sales growth, which trounced analyst estimates. The only negative in the report was that commodity costs came in higher than expected, stealing the sales leverage and leading to a 400 basis point decline in restaurant operating profit.
That said, this is still a very respectable figure, and the contraction in margins was largely due to being so conservative with pricing since the pandemic began. With the benefit of an overdue 3.9% price increase in July, I expect much of this margin pressure to abate.
(Source: FASTGraphs.com)
Despite this incredible sales performance in a quarter where traffic has been anemic, First Watch trades at a very reasonable valuation, sitting at just 10x FY2023 cash flow estimates. This might appear steep at first glance, but this business is growing units at a double-digit pace, making it one of the fastest-growing brands sector-wide.
Importantly, this growth is supported by growing average unit volumes, solid margins, and supportive staff, de-risking the growth profile vs. other brands. So, if this weakness in the stock persists, I would view any pullbacks below $14.40 (9.3x FY2023 cash flow) as a buying opportunity.
Papa John’s International (PZZA)
Papa John’s International (PZZA) is a mid-cap pizza chain in the restaurant space, and the company just came off a huge year, reporting record annual earnings per share of $3.43, a 145% increase from the year-ago period.
This was driven by impressive same-store sales growth, opportunistic share buybacks, and double-digit unit growth, an impressive feat for a company with over 5,000 restaurants globally (5,650 restaurants in 50 countries as of year-end 2021).
However, the company’s phenomenal year pinned it up against tough year-over-year comps, having to lap 145% earnings growth in a macro environment that’s much trickier to navigate. While the softened Q2 results were largely out of the company’s control, they came in below what the market was looking for, with revenue of just $522.7, a 5% increase over the year-ago period.
Meanwhile, although comparable sales in North America remained positive at 0.90%, International comparable sales dipped deeply into negative territory at (-) 8.0%.
While this is undoubtedly an ugly headline number, it’s important to contextualize the two figures. Although comp sales were down on a consolidated basis and fell sharply internationally, Papa John’s two-year stacked same-restaurant sales are sitting at 6.1% and 13.2%, respectively, with International (13.2%) having to lap a 21.2% growth rate in Q2 2022.
These are solid figures, but the deceleration combined with inflationary pressures that hit earnings (quarterly EPS: $0.74 vs. $0.93) has put a severe dent in the stock.
(Source: FASTGraphs.com)
The good news is that this 42% correction has left PZZA trading well below its 10-year average earnings multiple of 35, and even if annual EPS sinks year-over-year, it will still be up over 120% vs. FY2020 levels. More importantly, it’s expected to hit new highs in FY2023 and FY2024 based on current estimates of $3.71 and $4.08, respectively.

Hence, I see this aberration in this strong earnings trend as a buying opportunity. That said, the ideal buy point for PZZA comes in at $77.00 or lower, where it would trade at ~21x FY2023 earnings estimates vs. what I believe to be a fair value of $110.00 per share, translating to a 30% discount to fair value.
While FWRG and PZZA may not be in low-risk buy zones, these are two names with strong growth that have loyal customer bases, boast strong unit growth, and are temporary victims of their success. This is because their strong FY2021 resulted in them being up against nearly insurmountable comps this year.
Still, I see the future as bright for both brands and meaningful earnings growth on the horizon post-2022, so I would view pullbacks below $14.50 on FWRG and $77.00 on PZZA as buying opportunities.
Taylor DartINO.com Contributor
Disclaimer: This article is the opinion of the contributor themselves. Taylor Dart is not a Registered Investment Advisor or Financial Planner. This writing is for informational purposes only. It does not constitute an offer to sell, a solicitation to buy, or a recommendation regarding any securities transaction. The information contained in this writing should not be construed as financial or investment advice on any subject matter. Taylor Dart expressly disclaims all liability in respect to actions taken based on any or all of the information in this writing.

2 Restaurant Stocks In Undervalued Territory Read More »

ETFs – How They Help Build Wealth

The idea of pooling investment assets has been around for centuries. Mutual Funds first appeared in the 1920s. But it wasn’t until the 1980s that mutual funds became widely popular with mainstream investors.
In recent years, ETFs have taken off as an alternative to mutual funds.
An exchange-traded fund (ETF) is a “basket” of stocks, bonds, or other financial instruments that gives convenient exposure to a diverse range of assets. ETFs are an incredibly versatile tool that can track anything from a particular index, sector, or region to an individual commodity, a specific investment strategy, currencies, interest rates, volatility, or even another fund.
You can do about anything with them — hold a diversified portfolio, hedge, focus on a particular sector, or even profit in a bear market.
The most significant practical difference between mutual funds and ETFs is that ETFs can be bought and sold like individual stocks — and mutual funds cannot. Mutual funds can only be exchanged after the market closes and their Net Asset Value (NAV) is calculated. Shares of ETFs can be traded throughout regular market hours, like shares of stock.

Both mutual funds and ETFs have expense fees that can range from low to high. Mutual funds can have front or backend loads or redemption fees in addition to management fees.
ETFs that trade like shares have commissions to buy and sell. But some ETFs are so popular that brokers offer commission-free trading in them.
So Many Choices
The sheer number and variety of ETFs can be a bit mind-boggling. Over the last 20 years, we’ve seen just a couple hundred ETF offerings grow to more than 8,000 worldwide, encompassing more than 10 trillion in assets.
A surprising number of ETFs have failed. They started with an interesting focus (well, “interesting” to somebody) but failed to attract enough interest to remain viable. For this very reason, I avoid narrow niche ETFs that trade with low volume.
I eliminate many ETFs on poor liquidity alone. I’m not interested if there’s not much volume in a product. I don’t want to suffer high slippage from wide bid/ask spreads. I want to get in and out quickly and at fair prices.
To leverage or not to leverage?
Inverse and leveraged ETFs often use derivatives like options, futures, and short-term contracts to achieve 2x or 3x the daily change in the assets they’re intended to track.
These types of instruments have inherent time decay, and they tend to lose value over time, regardless of what happens in the index or benchmark that the ETF tracks. As a result, these products are best for very short holding periods or day trading.
Options on ETFs
Many ETFs have options (puts and calls) available. But even if the ETF itself trades with decent volume, that does not mean that the options meet my criteria for liquidity.
Sometimes I will use long options – puts or calls — if a clear directional move is in play. I also use many of my option premium selling strategies on popular ETFs. Just like with stocks, options can be used with ETFs for additional leverage, collecting premiums for income, and risk management.
An ETF Playlist
Here are some of my favorite ETFs and how I use them.
SPY, QQQ, IWM – Major index ETFs with huge participation. I use options strategies with these to collect premiums or profit from longer-term directional moves.
XLE, XLF, XHB, IYT, XLU, SMH – Sector Exposure. These can work well for directional trades in specific sectors. I like these sector plays as they can give a lot of protection against individual stock risk.
DBC, USO, UNG, WEAT, GLD, SLV, COPX, GDX, URA – Commodity Exposure. All of these can work well when the underlying commodities are appreciating. I tend to use these with option premium selling strategies such as covered calls and diagonal spreads.
TQQQ – Triple leveraged to the QQQ. This very popular ETF can work well to capture very short-term bullish moves in the Nasdaq 100 stocks.
SQQQ – This is the companion inverse ETF to TQQQ. It is triple-leveraged and inverse to QQQ. Long calls on SQQQ can work well to capture gains from a very short-term down move. Timing is everything in short-term trading, so I get in and out quickly, with trades lasting no more than a few days.

UUP – US Dollar Index. This can be a real winner when stocks are weak and the dollar is strong. Implied volatility on options is relatively low, so buying call options can work well if you catch a directional move. Using calls can give about 10x leverage; for example, a 3% increase in UUP might yield around a 33% gain for an in-the-money call option.
Technical Analysis
Whether an individual stock or an ETF, my answer for when to buy or sell is always based on price action. We only want to hold assets that are increasing or at least keeping their value while avoiding assets that are in decline.
And the toolset to evaluate price action is technical analysis. The same technical analysis we use for stocks works just as well for the more popular ETFs.
Learn more by visiting The Technical Traders!
Chris VermeulenTechnical Traders Ltd.
Disclosure: This article is the opinion of the contributor themselves. The above is a matter of opinion provided for general information purposes only and is not intended as investment advice. This contributor is not receiving compensation for their opinion.

ETFs – How They Help Build Wealth Read More »