

Back in July, I shared with you a chart of Market Distortion where I put together crude oil and platinum futures. I spotted a disruption of a strong correlation pattern between these two instruments that has been lasting for a quarter of a century.
That post drew your attention with strong support and feedback as readers shared their valuable comments. Below is the graph showing the distribution of your opinion on how the divergence would play out.
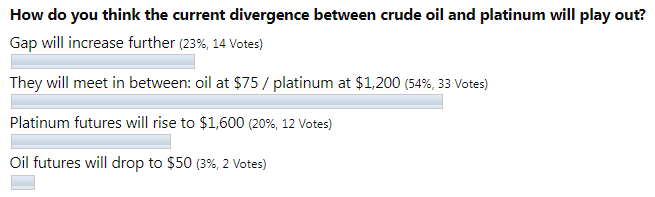
The majority of readers chose the option that implies the equal move in the opposite direction of both instruments to meet somewhere in between – crude oil should drop to $75 and platinum futures should rocket to $1,200. The second largest bet was on the widening gap.
I prepared for you an updated chart below to see what happened after two months.
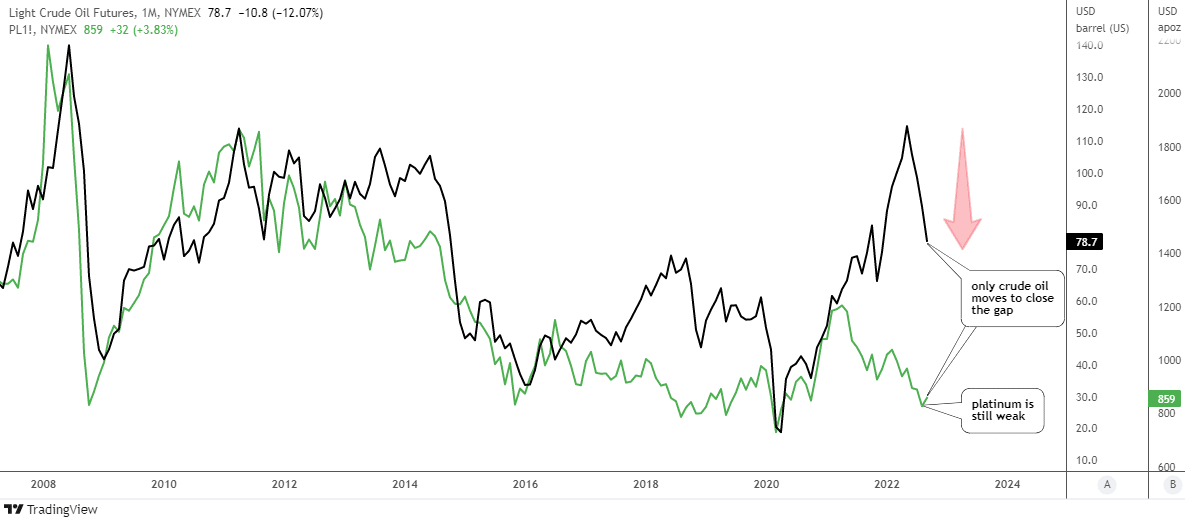
None of the bets have hit it right, although your main choice is still the closest. Indeed, the crude oil futures (black line) did its job fully to close the gap as it almost touched the $75 area. The lowest handle hit was $78 so far.
The counterpart, as it often happens in human relationships, did not meet the other part halfway. The platinum (green line) is still weak as it can’t raise its head to the upside.
Should crude oil do the job for both and drop even lower like a rock to catch up with the metal? Or is platinum quietly accumulating power for a rally?
Let us check the latter in the weekly chart of platinum futures below.
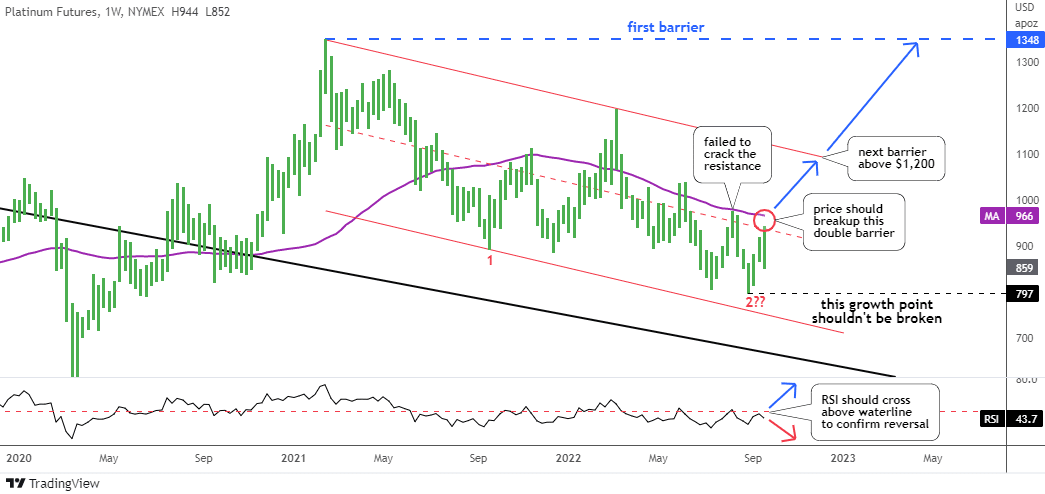
I zoomed in on the big map of platinum futures posted in July to focus on the pullback that is still in progress as we didn’t see the touchdown on the black support. I contoured it with the red downtrend channel. The downside of the channel hasn’t been hit as well.
I put the question mark on the second red leg down as it has yet to travel the distance of the first leg down. However, the main criteria of a lowest valley has already been met as the minimum price of $797 was $10 down compared to the previous valley. This gives hope for a reversal that failed earlier in the summer.
So far, the price has failed to overcome the double barrier on its way to the upside both last month and this month. That resistance consists of a 52-week simple moving average (purple) at $966 and the mid-channel (red dashed) around $940. The chance for reversal is still there as long as the price is above the current growth point (black dashed) of $797.
The RSI couldn’t break up during two attempts either. It should cross the “waterline” of 50 to the upside to support the potential rally.
The upside of the red channel is the next resistance around $1,200, right where crude oil has been waiting for it.
Intelligent trades!
Aibek Burabayev
INO.com Contributor
Disclosure: This contributor has no positions in any stocks mentioned in this article. This article is the opinion of the contributor themselves. The above is a matter of opinion provided for general information purposes only and is not intended as investment advice. This contributor is not receiving compensation (other than from INO.com) for their opinion.
