Nvidia Is Finally Worth a Look
In recent years, whenever there has been hype in the computing sector in recent years, the GPUs (graphic processing units) produced by Nvidia Corp. (NVDA) have been involved. GPUs underpin almost all of the most exciting computing developments, from artificial intelligence (AI) to data centers to autonomous driving to video gaming graphics.
No wonder then that, in 2021, near-zero interest rates, coupled with pandemic lockdown tailwinds, saw the stock bid up by 130%, to a peak valuation of 71 times forward earnings.
However, 2022 has been a completely different story for stocks, particularly technology stocks. Rising inflation and interest rates, as well as the war in Ukraine, sent technology stocks plunging.
Nvidia’s stock has fallen nearly 50% year-to-date and is now trading on a saner forward price/earnings ratio of around 50. Given the company’s explosive growth potential in the years ahead, this is an entry point worth looking into. So let’s look at where Nvidia stands.
Nvidia Today
Before the turn of the century, computers ran on central processing units (CPUs) that were first made commercially available by Intel in 1971. Although the power of CPUs improved rapidly in the first few decades after their widespread adoption, this progress had started to slow by the end of the century.
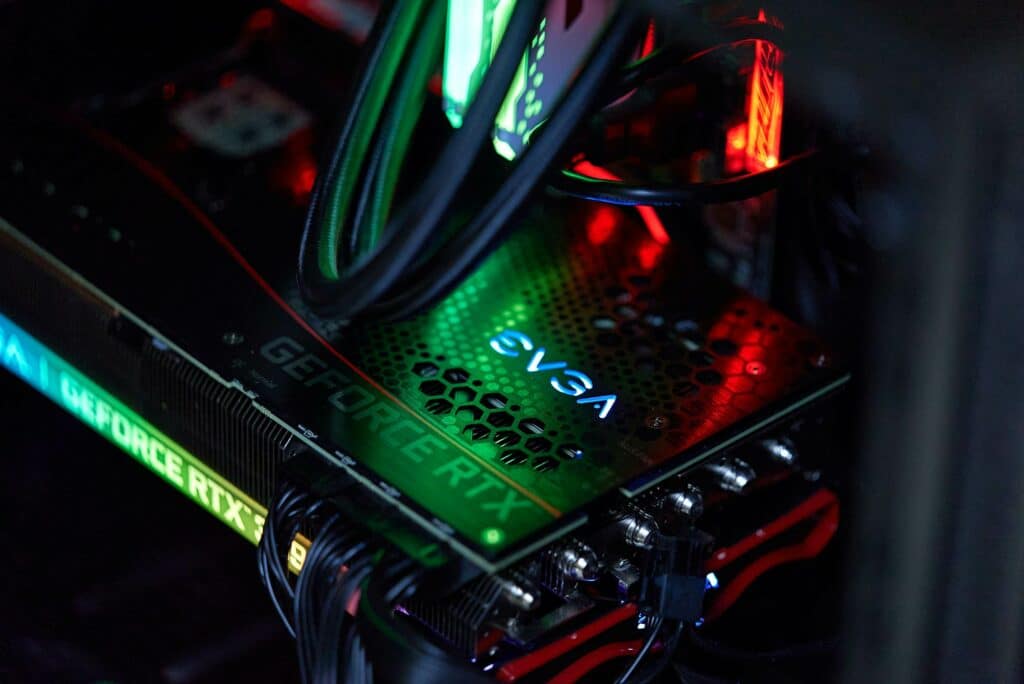
Then, in 1999, Nvidia invented the GPU, which allows for faster computing because it uses matrix calculations (parallel computing) rather than linear calculations. Nvidia began by designing GPUs for PCs to improve gaming graphics, but since then has expanded into data centers, professional visualization, and the automotive industry.
In the third quarter of 2021, data centers made up 65% of Nvidia’s sales, with gaming accounting for a further 26%, followed by automotive and professional visualization with around 4% and 3% respectively.
It is interesting to note that automotive revenue of $251 million rose 15% sequentially and 86% annually in the third quarter. Nvidia believes that the middle of the 2023 fiscal year was an “inflection point” for automotive, as its DRIVE Orin—the central computer for autonomous driving—has “great momentum.”
In fact, Morningstar said the following: “The firm has a first-mover advantage in the autonomous driving market that could lead to widespread adoption of its Drive PX self-driving platform.”
Data Center Dominance
Data centers have only recently surpassed gaming to become the dominant division in the business. It’s easy to see why…
The consumer-facing internet and cloud giants—Alphabet, Meta, Amazon, and Microsoft—have found GPUs to be very useful at accelerating cloud workloads that use deep learning techniques to achieve speech recognition (Siri, Alexa, etc.), photo recognition (identifying faces in pictures on Facebook, cat videos on YouTube), and recommendation engines on Netflix and Amazon.
In the third quarter of 2022, Nvidia’s data center revenue soared 31% from a year ago, to $3.83 billion. This was thanks in part to Amazon Web Services’ (AWS) growing use of the NVIDIA A100 Tensor Core processor in its servers.
Along these lines, Nvidia recently announced new two-year partnerships with Oracle Corp. (ORCL) and Microsoft Corp. (MSFT) during the quarter. The Microsoft deal consisted of a contract to “build an advanced cloud-based AI supercomputer to help enterprises train, deploy, and scale AI state-of-the art models.”
Nvidia is also developing HPC (high performance computing)-as-a-service offerings, including simulation and engineering software used across industries. The company’s GPUs are deployed in 72% of the top 500 supercomputers globally, and in 90% of the new computers on that list.
Perhaps the most important characteristic of Nvidia is that it is fabless: it outsources its GPU, mostly to Taiwan Semiconductor (TSM). While this business model does leave the company dependent on TSM, it also makes Nvidia a capital light, high margin, and highly cash generative business. In 2021, its operating margin stood at 40% and its free cash flow hit an impressive $8.13 billion from just $10.7 billion of operating profit.
Nvidia Outlook
Nvidia is sitting in the proverbial catbird seat.
The company has little competition in the GPU market. Intel Corp. (INTC) and Advanced Micro Devices Inc. (AMD) make CPUs for the cloud servers, but neither can yet challenge Nvidia in designing GPUs used for machine learning and AI. For instance, Intel only launched its first GPU for data centers in 2021.
I agree with Morningstar’s assessment that Nvidia’s the data center division will enjoy at a 25% compound annual growth rate (CAGR) through fiscal 2027. And its CAGR during the same period for the automotive segment could be around 50%.
However, there is more to the future of the GPU market than just greater corporate use of the cloud. Nvidia management has said that consumer-oriented AI applications—such as “large language models, recommendation systems and generative AI”—are already driving growth, alongside the major cloud players.
This could be huge. New technology is often first adopted by companies, but demand doesn’t really grow quickly until consumer applications appear. Go back a few decades and think about how computing didn’t really take off until the personal computer for consumers appeared.
The one big cloud on Nvidia’s horizon is geopolitics and the de-linking of the American and Chinese economies. During the third-quarter results conference call, Nvidia management said: “…sequential growth was impacted by softness in China,” although no direct link to the recently passed CHIPS and Science Act legislation in the U.S. was mentioned.
Keep in mind that in 2021, 26% of Nvidia’s revenue came from China, another 32% from Taiwan, and only 16% was from the U.S. To get around the current U.S. sanctions, Nvidia has already designed a less powerful GPU that can be sold to Chinese data center businesses, but that cannot be used in supercomputing. But it is always possible the U.S. could change the law again to prevent any GPUs designed in the U.S. from being shipped to China.
That is why we are seeing a multi-year discount in the market valuation for Nvidia, a business with seemingly endless potential.
NVDA stock will not be a huge upward mover until the macroeconomic environment is more settled. However, you can begin building your position now in Nvidia, anywhere in the low-to-mid $100s.
It’s raised its dividend 37.5% on average, could be acquired, benefits from rising interest rates, trading at massive discount, and pays an 8% yield. This is my top pick for income during a rough market.Click here for details.
Nvidia Is Finally Worth a Look Read More »