Ever since the onset of the pandemic, one consistent characteristic of the global economy has come to the fore again and again: shortages of physical goods.
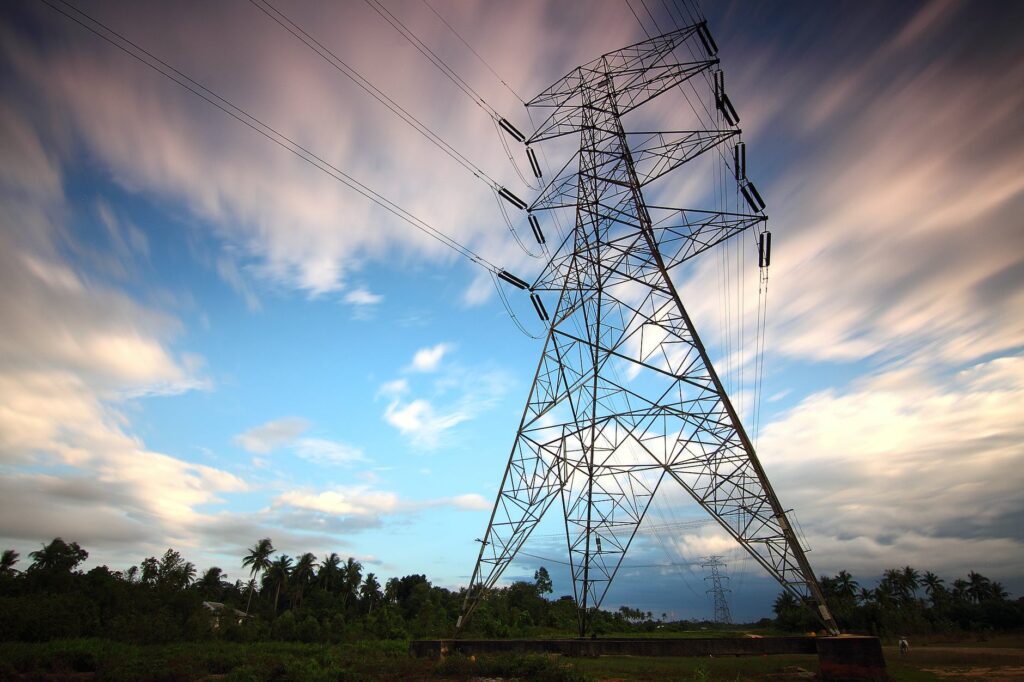
The latest shortage to rear its head is a worldwide shortage of fiber-optic cable, driving up prices and lengthened product delivery times and endangering telecommunications companies’ ambitious plans to roll out state-of-the art 5G telecommunications infrastructure.
Fiber-Optic Cable Shortage
The consultancy CRU Group says cable shortages are particularly acute in Europe, India, and China. In those locations, prices for fiber-optic cables have soared by up to 70% from the record lows in March 2021, from $3.70 to $6.30 per kilometer (1 kilometer = 0.621371 miles).
Overall, the price for fiber-optic cable has now reached its highest levels since July 2019. And lead times for some products have stretched out from just 20 weeks to nearly a year for many smaller customers.
As CRU analyst Michael Finch told the Financial Times: “Given that the cost of deployment has suddenly doubled, there are now questions around whether countries are going to be able to meet targets set for infrastructure build, and whether this could have an impact on global connectivity.”
CRU told the Financial Times that total cable consumption jumped by 8.1% in the first half of 2022 compared with the same time last year. China accounted for 46% of the total; North America came in as the fastest growing region, with a 15% year-over-year increase.
So why have the shortages occurred? The answer is the same as in the semiconductor industry: shortages and rising prices for many of the crucial components that go into making fiber-optic cables.
There is an ongoing shortage of helium, a key component in the manufacture of fiber-optic glass, thanks to plant outages in both Russia and the U.S. This has caused helium prices to spike by 135% over the past two years. In addition, CRU reports, prices of another key component in fiber production, silicon tetrachloride, have increased by up to 50%.
The CEO of Corning (GLW), Wendell Weeks, said to the Financial Times, “In my professional career I’ve never seen anything like this inflationary crunch.” Corning, which is the biggest producer of fiber-optic cable in the world and played a major role in inventing the technology in 1970, is ramping up production capabilities to meet soaring demand coming from governments, telecoms companies and big tech groups like Amazon, Google, Microsoft and Meta. The company is building new facilities in both the Europe and the U.S.
Let’s take a closer look at Corning.
Corning: Fiber Optics and More
Corning is much more than just a producer of fiber-optic cables: the company is a materials science giant with differentiated glass products for televisions, notebooks, mobile devices, wearables, optical fiber, cars, and pharmaceutical packaging. Corning is also the leading global supplier of precision glass for liquid crystal displays, and participates in the environmental business, with a focus on emission substrates for gasoline and diesel engines as well as producing polysilicon for the solar industry.
The company is also active in the life sciences business, producing vaccine vials. Its specialty materials operations produce Gorilla Glass, the fast-growing, tough-cover glass used in smartphones and tablets.
In its 170 years of operation, the company has always been an innovator, including inventing the aforementioned glass optical fibers and ceramic substrates for catalytic converters. That innovation is a direct result of Corning’s ability to use its scale to invest heavily in research and development—$1 billion or more per year—and spread these expenses across its five segments: optical communications, display technologies, environmental technologies, life sciences, and specialty materials.
Corning is a winner in many of these segments, with a leading market share in four distinct end markets: optical fiber, display glass, cover glass, and emissions substrates/filters.
But, most importantly, Corning, being a key enabler of 5G networks, has a product portfolio that’s nicely aligned toward the worldwide secular trends of increasing connectivity and efficiency.
Secular demand strength in this segment will offset any weakness in demand elsewhere. For example, in the second quarter, the optical fiber segment grew 22% year over year. That turned Corning’s results from just average to a good overall result.
Argus Research said this about Corning: “In our view, GLW shares appear to more than discount the challenges ahead, without fully reflecting the myriad opportunities in Corning’s varied end markets.”
I totally agree, making GLW a buy anywhere in the mid-to-upper $30s per share.
What’s the one thing you need to stay retired? That’s right… cash. Money to pay the bills. Money to weather any financial crisis like the one we’re in now and whatever comes next. I’ve located three stocks that if you buy and hold them forever, they could serve as the backbone to your retirement. Click here for details.