

It’s all about persisting inflation at the end of the day. All markets watch how the Fed tries to fight it as aftershocks of rate decisions are observed in bonds, stock market, foreign exchange, precious metals and even crypto.
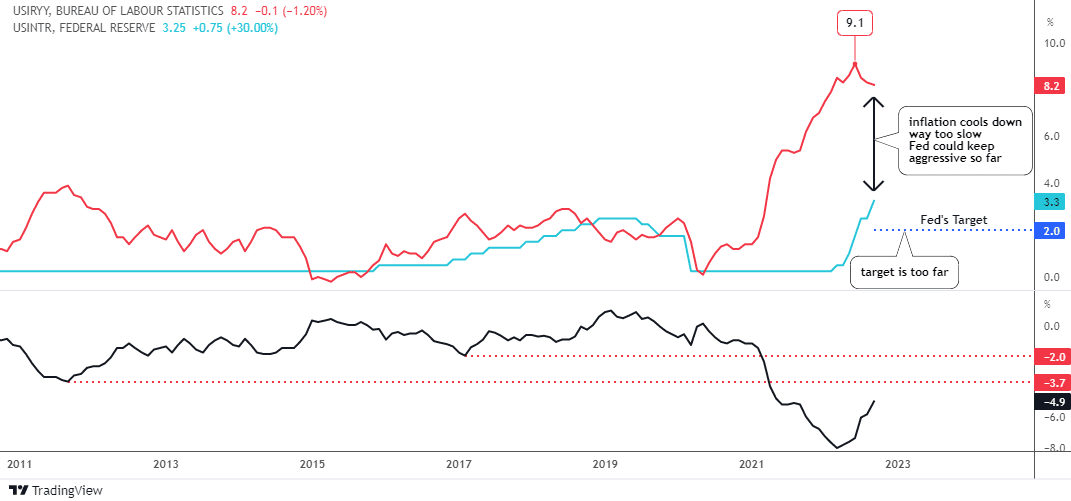
The graph above visualizes that “fight of the night”. Indeed, we witness some progress of the Fed’s efforts in the falling U.S. inflation (red line) numbers from the peak of 9.1% in the summer down to the latest data of September at 8.2%, which was still above the expected 8.1%.
The 3% increase of the Fed rate (blue line) brought inflation down only by 0.9%. It is way too slow, as the inflation target of 2% is still way too far, hence the Fed could keep their aggressive tightening mode.
Surely, there is a time lag between the Fed action and the inflation reaction. However, the time is ticking away as inflation is like a fire – the earlier it’s extinguished the better.
The real interest rate (black line, down pane) crossed over the August top above the -5.1%. The next resistance is at -3.7% (valley of 2011) and it is highly likely to be hit soon as it is only 1.2% away. The valley of 2017 in -2% is almost 3% away, which means a huge Fed rate hike or a big drop of inflation. We can’t rule it out anyway.
Indeed, these interest rate projections above could make precious metals life tough. Let’s check the gold futures chart below.
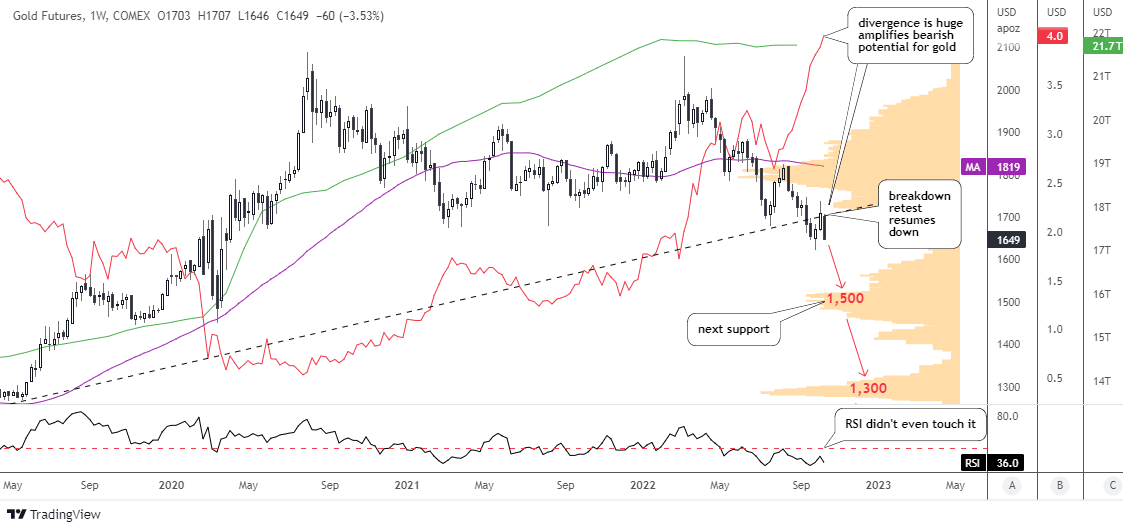
The gold futures price has lost ground last month as it has dived below the July growth point of $1,678. It was a double support as the price also breached the black dashed long-term trendline. We can see the textbook price action there – breakdown, retest of broken support and resumption of collapse.
The yield of 10-year U.S. Treasury bonds (red line) skyrocketed to 4%, extending the divergence with the gold price hugely. This amplifies the bearish potential for the gold price massively.
I added the US M2 money supply indicator (green line) to show you that it is flat and it offers a cap for the gold price. It suppresses the bullish potential for the metal as the “printing press” has stopped.
The Volume profile indicator (orange) shows that the price is in the volume gap as there is no support until it drops to $1,500. Beware of it, as it is not as thick as the above resistance area at $1,800 and the next support zone at $1,300.
The RSI is in bearish mode as it didn’t even touch the waterline during the price retest of the broken support.
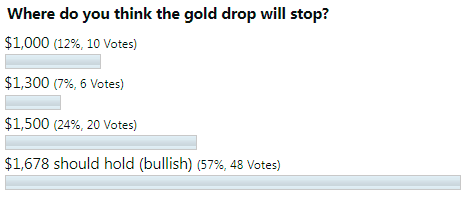
Last time the majority of readers chose the only bullish option that the price would hold the ground of $1,678. This is that rare case when your main bet did not play out.
The next support of $1,500 was the second choice. In terms of Volume profile indicator, the $1,300 support is larger than the $1,500. However, the $1,300 option has been skipped in favor of really “die-hard” support of $1,000. It means that readers consider $1,500 as a “fly or die” option.
Intelligent trades!
Aibek Burabayev
INO.com Contributor
Disclosure: This contributor has no positions in any stocks mentioned in this article. This article is the opinion of the contributor themselves. The above is a matter of opinion provided for general information purposes only and is not intended as investment advice. This contributor is not receiving compensation (other than from INO.com) for their opinion.
