×

It’s not goodbye, it’s hello Magnifi!

You are now leaving a Magnifi Communities’ website and are going to a website that is not operated by Magnifi Communities. This website is operated by Magnifi LLC, an SEC registered investment adviser affiliated with Magnifi Communities.

Magnifi Communities does not endorse this website, its sponsor, or any of the policies, activities, products, or services offered on the site. We are not responsible for the content or availability of linked site.

Take Me To Magnifi

INO.com

Two Standouts in the Gold Sector

While the cyclical bear market in the S&P-500 (SPY) has created buying opportunities, the real value can be found in the Gold Miners Index (GDX).
This is because the sector has endured a 22-month bear market, sending many names down 60% from their highs.
Although several names offer compelling buying opportunities, two stand out as offering a rare mix of growth and value. These are i-80 Gold (IAUX) and Sandstorm Gold Royalties (SAND).
Investing in the precious metals sector can be treacherous and intimidating, with several names to choose from, multiple pitfalls, and lengthy technical reports describing each mine.

For this reason, the sector is often avoided by generalist investors. The proposition becomes even less interesting if we mix in a declining gold price.
However, there is one key trait in gold miners that allows investors to worry less about the gold price: production growth. The key is selecting names with growth and low-risk business models with a high probability of successful execution, which is easier said than done.
Sandstorm Gold Royalties (SAND)
Sandstorm Gold Royalties is a precious metal royalty/streaming company, giving it a lower-risk business model within the sector. This is because it provides upfront capital to operators/developers to construct/expand mines, and in exchange, it receives a portion of metal production over the mine life.
The result is that it’s highly diversified (dozens of revenue streams and jurisdictions), and it’s protected from inflation as it doesn’t have to pay for sustaining capital or get hit by rising operating costs.
In addition, it enjoys very high margins (80% plus gross margins), with it simply receiving gold deliveries of metals at a low fee ($10/oz to $500/oz gold) vs. $700/oz to $1,300/oz costs for operators.
The other major benefit of this model is that any discoveries on properties where it holds royalties are gravy, given that the mine can continue to deliver ounces for decades even if the mine life was estimated at only several years initially.
A couple of examples are an investment in Goldstrike which turned $2.0 million into $1.0 billion paid in royalties, and an investment in Cortez which translated to a 500% plus return for Royal Gold. This is why royalty/streaming companies commonly trade at a premium to their net asset value.
However, Sandstorm today trades at a valuation of just 0.80x price to net asset value (P/NAV) despite having the leading growth rate among its peers and the best diversification profile. This is evidenced by its ability to grow annual attributable production to 155,000 gold-equivalent ounces [GEOs] in 2025, up from 85,000 GEOs this year, representing a 22% compound annual growth rate.
The result is that its annual free cash flow should increase to more than $180MM in FY2025, allowing the company to graduate from the smaller-scale royalty/streamers to the larger-scale ranks, which often is accompanied by a meaningful increase in the stock’s multiple.
Based on what I believe to be a fair P/NAV multiple of 1.50 for Sandstorm due to its diversified portfolio and an industry-leading growth rate, with an estimated net asset value of $1.8BB, I see a fair value for the stock of $2.7BB.
After dividing this figure by 306MM shares, this translates to a fair value of $8.82 post-acquisition/financing. From a current share price, this translates to an 85% upside from current levels, making SAND one of the most undervalued names in the precious metals sector.
This undervaluation, combined with limited reliance on the gold price to grow cash flow/earnings (due to its volume growth), makes the stock steal below $5.00.
I-80 Gold (IAUX)
I-80 Gold is a lesser-known name in the sector, boasting a market cap of $500MM and only having been publicly traded for a little over a year as it was a spin-out from the acquisition of Premier Gold.
Fortunately, in I-80’s case, the company ended up walking away with some of the best properties in its spin-out and now owns three phenomenal projects in the #1 mining jurisdiction: Ruby Hill, Granite Creek, and McCoy-Cove.
The issue from a valuation standpoint was that it needed a way to process the material at these projects but didn’t have an autoclave capable of processing refractory mineralization, and building one would cost well over $1.0BB. However, in a creative transaction, the company swapped projects with Nevada Gold Mines to scoop up an idled autoclave and now controls its destiny.
Given that the asset isn’t currently in production and was idled, I-80 Gold will need to spend over $200MM to get it back into production, which will be helped by over $100MM in cash and a small debt raise to help fund this refurbishment.
The good news is that in completing this deal to acquire the Lone Tree Facility with autoclave, the company secured a toll-milling deal with Nevada Gold Mines, allowing it to generate cash flow from Q1 2023-Q1 2025 while it refurbishes Lone Tree. This allows it to generate cash flow in the meantime to help pay for exploration/development.
So, what’s so special about the story?
While there’s not much special about a 70,000-ounce producer (estimated FY2023 production for I80 Gold), the company’s three projects can produce over 250,000 ounces by FY2025 once its refurbishment is complete and could see production grow to 550,000+ ounces by the end of 2028 in an upside case.
This represents the highest-growth rate in the sector, potentially allowing I-80 Gold to increase its revenue from $130MM in FY2023 to $475MM in 2026 and more than $900MM in 2028. These are preliminary estimates, but given the strong team the company has assembled with considerable Nevada experience, I see these goals as achievable.
Despite this industry-leading growth rate, I80 Gold trades at a P/NAV multiple of 0.35x at $1.90, and given the high-grade discoveries being made, its P/NAV multiple could dip to 0.30x as it continues to add ounces across its projects. Notably, these projects host some of the highest-grade gold mines in North America, which should allow I80 to produce at industry-leading margins.

So, with a growth rate that doesn’t even come close to being rivaled by peers and multiple new discoveries that suggest I80 Gold could grow its resource base to 20+ million ounces of gold, I see more than 150% upside to a fair value of US$4.75, and the stock as a steal at a valuation of less than $30/oz of gold.
While the gold sector can be tricky to invest in, investors sometimes get fat pitches, and this is what they’ve been presented with today due to a nearly 2-year bear market.
Two of my favorite ideas are I80 Gold and Sandstorm Gold, and with the recent pullback in both stocks, I see this weakness as a gift and am continuing to accumulate on weakness.
Disclosure: I am long SAND, IAUX, SPY
Taylor DartINO.com Contributor
Disclaimer: This article is the opinion of the contributor themselves. Taylor Dart is not a Registered Investment Advisor or Financial Planner. This writing is for informational purposes only. It does not constitute an offer to sell, a solicitation to buy, or a recommendation regarding any securities transaction. The information contained in this writing should not be construed as financial or investment advice on any subject matter. Taylor Dart expressly disclaims all liability in respect to actions taken based on any or all of the information in this writing. Given the volatility in the precious metals sector, position sizing is critical, so when buying small-cap precious metals stocks, position sizes should be limited to 5% or less of one’s portfolio.

Two Standouts in the Gold Sector Read More »

How to Interpret the Jobs Report

Friday’s jobs report for September showed a decrease in monthly gains, with 263,000 new jobs added last month, a decline from the prior month in which 315,000 new jobs were added.
The deep impact it had on almost every asset class in the financial markets was not because of the tepid numbers but rather hopes by the Federal Reserve that these numbers would be even lower.

The Federal Reserve had hoped that Friday’s report would reveal even slower growth because that would indicate progress by the Federal Reserve in reducing inflation.

Inflation is still greatly elevated at a 40-year high even after the Federal Reserve has raised interest rates at every FOMC meeting since March. The Fed raised rates by 25 basis points in March, 50 basis points in May, and 75 basis points in June, July, and September. The Fed took their benchmark Fed funds rate from between 0 and 25 basis points in February to between 300 and 325 basis points in September.
[embedded content]
Although Friday’s report indicated slowing job growth it is believed that this contraction is not enough for the Federal Reserve to slow down its current pace of interest-rate hikes.

According to CME’s FedWatch tool, the previous week there was a 56.5%% probability, last week there was a 75.2% probability which Friday swelled to an 82.3% probability that the Federal Reserve will raise rates by 75 basis points for the fourth consecutive time at the November FOMC meeting. This probability indicator forecast the probability of FOMC rate moves by using the 30-day Fed Funds futures pricing data.

Friday’s report had a profound effect on U.S. equities. As of 2:35 PM EDT, the Dow is currently trading off by 661 points a decline of 2.22%. The NASDAQ is currently down 3.75% a decline of approximately 415 points, and the S&P is down 106.16 points or 2.90%.
Friday’s report also had a deep impact on gold pricing which opened at $1721 and then traded to a high of $1722.80 before the release of the report which took gold futures basis the most active December contract to today’s low of $1698.40. Gold futures did recover trading to approximately $1714 a few hours after the release of the report. However, as of this writing at 3:20 PM, EDT (Friday) over the last hour gold has been trading between $1702 and $1706.
So, what does this mean for the future of gold pricing? I believe that although this report is extremely important in an exceedingly important data set that the Federal Reserve will use at their November 2 FOMC meeting, it will be this week’s CPI inflation report for September that will be much more significant.

But in terms of the long-term effect of the Federal Reserve on gold pricing, it is highly likely that if the Fed continues to raise rates and inflation remains persistent at some point market participants will have to focus on the high level of inflation rather than being laser-focused on rising rates. If that assumption is correct, it could take gold dramatically higher. But it is also likely that there will be more pain ahead.

Our technical studies indicate that the first level of resistance occurs at $1710 the 23.6% Fibonacci retracement which is based on a very short-term Fibonacci retracement data set from September 28 to October 7. Major resistance occurs at $1738 the recent high of the rally which began after gold hit its lowest value in years at $1621. The first level of support occurs at $1693.80 the 38.2% Fibonacci retracement and then at $1689.40 a 42% retracement.
For those who would like more information simply use this link.
Wishing you, as always good trading,Gary S. WagnerThe Gold Forecast

How to Interpret the Jobs Report Read More »

Familiar Pattern in the AMD Chart

The Fed’s tightening puts hard pressure on the broad stock market and chip makers are not the exception. The strong labor market statistics and ongoing inflation pressure supports the hawkish mode.
If one thinks that the sell-off might be over, there is a chart below that I spotted a disastrous model for a well-known chip maker Advanced Micro Devices, Inc. (NASDAQ:AMD).
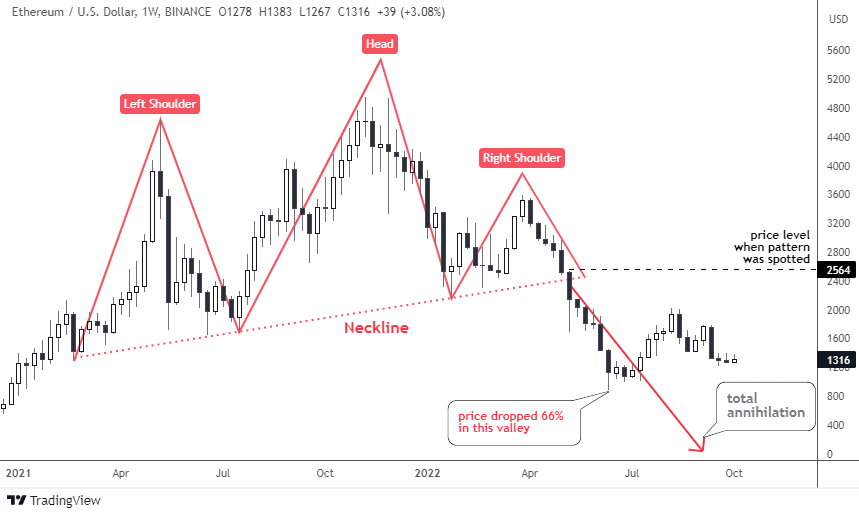
You definitely know this chart pattern I spotted for you. It is a Head & Shoulders reversal model. Last time this notorious chart pattern appeared in my posts was in May on the chart of Ethereum cryptocurrency. I updated it for you below to illustrate the historical sample.

Source: TradingView
As soon as the price crossed below the Neckline beneath $2,400, Ethereum collapsed as it had lost a tremendous 66% down in the valley of $884 in June from the post level of $2,564.
This is how this model has played out before and that is what we could expect in the next chart of AMD below.
Source: TradingView
The Head & Shoulders pattern (pink) here is more balanced compared to up-sloped model in the Ethereum chart. The Neckline touch points are located almost exactly at the same level of $72, hence it is a flat line. The Head is quite tall above the wide Left Shoulder and the narrow Right Shoulder. The top of a latter offers a strong resistance and the invalidation point.
The 52-week moving average (purple) fortifies the above mentioned resistance as it is located in the same area.
The price has already crossed down the Neckline of $72 and the collapse only accelerated. The target rule requires us to subtract the height of the Head from the Neckline, this math results in a negative number of minus $21. The stock price can’t go negative; thus it means the total annihilation of AMD price as it was earlier indicated for Ethereum.
Indeed, the latter fell sharply, however, its price has still four digits not a single-digit. Instead of a doomed target, I highlighted two supports in the chart to watch.
The next support is located in the area of 2018-2019 tops and 2020-year valley at $34. Currently, this price tag corresponds to the book value of the stock. Amazing coincidence of technical and fundamental levels.

The last support in the double-digit area is located at the top of the 2017-year and valley of a 2018-year at $16.
AMD announced preliminary third quarter 2022 financial results last week. According to a press release from the company, revenue is anticipated to be $5.6 billion, which is much less than the initial prediction of $6.7 billion.
“The PC market weakened significantly in the quarter,” said AMD Chair and CEO Dr. Lisa Su. “While our product portfolio remains very strong, macroeconomic conditions drove lower than expected PC demand and a significant inventory correction across the PC supply chain.”

 Loading …
Intelligent trades!
Aibek BurabayevINO.com Contributor
Disclosure: This contributor has no positions in any stocks mentioned in this article. This article is the opinion of the contributor themselves. The above is a matter of opinion provided for general information purposes only and is not intended as investment advice. This contributor is not receiving compensation (other than from INO.com) for their opinion.

Familiar Pattern in the AMD Chart Read More »

ETF Explores New Signals Behind Corporate Profitability

There are many factors in play when it comes to a company’s ability to succeed and reward shareholders.
One of the most difficult factors to measure has been human capital.
Current accounting methods treat human capital as a current or future expense.
Real estate and production equipment add to the balance sheet. However, a highly-skilled (and well-paid) workforce just detracts from profit and value.
In short, measuring the value of human capital in a business has been downright impossible. How do you quantify who has the best employees or how driven the employees are to drive corporate success?
How do you know when employees feel engaged, feel empowered to innovate, and feel like both the management and the mission align with their values?
Famed author and behavioral economist Dan Ariely is a founding member of Irrational Capital. This investment research firm that has unlocked the connection between companies with a high level of human capital and success in the marketplace.
Irrational Capital’s Human Capital Factor (HCF) Index has the potential to change how businesses are valued forever.
Catch Dan’s interview with TIFN CEO Vinay Nair where Dan explains the research behind HCF and Habor Corporate Culture Leaders ETF (HAPY), a fund based on his research.

Loading the player…

Want A Free Share of HAPY, the ETF based on Mr. Ariely’s research?
For a limited time, grab a free share of HAPY when you open an account with Magnifi.
Click the button below, register for your Magnifi account, and you’ll get a free share of HAPY.
This is just one perk on top of access to some of the most incredible search tools to help find stocks and funds that fit you!

Please note that the offer is only eligible for new Magnifi customers, and this offer is only available until we hit the cap on available shares.
Learn more about HAPY here.

INO.com is providing an endorsement of Magnifi. INO.com, a division of TIFIN Group LLC, is affiliated with Magnifi via common ownership. Affiliates of Magnifi will receive cash compensation for referrals of clients who open accounts with Magnifi. Due to this compensation, a conflict of interest exists since INO.com has an incentive to recommend Magnifi LLC.
Magnifi LLC does not charge advisory fees or transaction fees for non-managed accounts. Clients who elect to have Magnifi LLC manage all or a portion of their account will be charged an advisory fee. Please see Magnifi’s Form ADV for additional information about fees and charges that may apply. Magnifi LLC receives compensation from product sponsors related to recommendations. Other fees and charges may apply.

ETF Explores New Signals Behind Corporate Profitability Read More »

New ETFs Worth Knowing About

Over the last 25 years, Exchange Traded Funds have seen incredible growth in the number of offerings. The increase is due to the high demand from investors, and because of this, ETF issuers are constantly coming up with new products they feel investors will want.
For example, in September this year, we saw 53 brand-new Exchange Traded Funds offered to investors. As you can see, this seems like issuers are essentially throwing a lot at the wall to see what will stick and what will not.
For the individual investor, it can be hard to dig through all the new offerings and determine which are viable investments and which are unlikely to produce market-beating returns. Today I will point out a few recent ETFs that I think are worth digging deeper into and, at the very least worth knowing, are available for investors to buy.
The first is the Direxion Daily Electric and Autonomous Vehicles Bull 2X Shares ETF (EVAV). This ETF is a two-times leveraged investment focused on the electric vehicle and autonomous driving industry.

We recently saw New York state following California’s lead, which will not allow new gas-burning vehicles to be sold in the state starting in 2035. With two of the largest states in the country moving towards banning sales of internal combustion engine-powered vehicles, the only option drivers will have in those states is to buy electric vehicles, pushing demand for EVs higher.
Furthermore, it is unlikely that all states in the US will make these laws with the same timeline, the year 2035, but it is hard to deny that other states won’t follow along in some form or fashion.
It also should be noted that the mass adoption of EVs is still probably years away. So while you look at EVAV, investors need to remember that it is a leveraged product. Meaning contango will occur, and thus EVAV is not an investment that should be held for long periods of time.
If you are looking for an ETF that you can buy today and have for decades to come, something like the iShares Self-Driving EV and Tech ETF (IDRV) would be an excellent place to start looking.
Next, I would like to point out the Defiance Daily Short Digitizing the Economy ETF (IBIT). The IBIT is an actively managed fund-of-funds that will offer inverse exposure to the Amplify Transformational Data Sharing ETF (BLOK). BLOK is an ETF that owns companies focusing on blockchain technology.
So if you believe the blockchain technology that Bitcoin, Ethereum, and all the other cryptocurrencies have been built on is not as valuable as others feel it may be, IBIT is a good investment for you.
I want to stress that this doesn’t mean that you think Bitcoin or any cryptocurrency is overvalued. It simply means the technology that they use to operate, and therefore the companies using that technology to do new things and make new products are not as valuable.
Lastly, IBIT is an inverse ETF; consequently, it, like EVAV, will experience contango and thus should not be held for long periods.
The last group of Exchange Trade Funds I would like to highlight is the family of new offerings from Direxion, their group of single-stock ETFs. Investors can now buy Direxions single stock ETFs for 1.5X bullish and 1X bearish exposure in Apple, Amazon, Google, Microsoft, and Tesla.
Direxion Daily AAPL Bull 1.5X Shares (AAPU)Direxion Daily AAPL Bear 1X Shares (AAPD)Direxion Daily AMZN Bull 1.5X Shares (AMZU)Direxion Daily AMZN Bear 1X Shares (AMZD)Direxion Daily GOOGL Bull 1.5X Shares (GGLL)Direxion Daily GOOGL Bear 1X Shares (GGLS)Direxion Daily MSFT Bull 1.5X Shares (MSFU)Direxion Daily MSFT Bear 1X Shares (MSFD)Direxion Daily TSLA Bull 1.5X Shares (TSLL)Direxion Daily TSLA Bear 1X Shares (TSLS)
Direxion’s single stock offers are a direct competitor to AXS Investments’ single stock offers, which is great for investors since we now have competition in this new realm of ETFs.

Not all new ETFs are good, and not all are bad. They each have their place and investor they are focusing on pleasing. But some are worth knowing more than others, which is why you should check back once a month or so to see which new ETFs I feel may help you invest better. Also, leave me a comment below and let me know what you think about the ETFs I highlighted above.
Matt ThalmanINO.com ContributorFollow me on Twitter @mthalman5513
Disclosure: This contributor did not hold a position in any investment mentioned above at the time this blog post was published. This article is the opinion of the contributor themselves. The above is a matter of opinion provided for general information purposes only and is not intended as investment advice. This contributor is not receiving compensation (other than from INO.com) for their opinion.

New ETFs Worth Knowing About Read More »

Restaurant Stocks: “David vs Goliath”

It’s been a rough year thus far for the restaurant industry, with a pullback in traffic, higher costs due to commodity/wage inflation, and a challenging environment for some companies from a traffic standpoint.
The result is that much of the group has become un-investable, and some names are looking worse by the month, including Red Robin (RRGB), which will post its third straight year of heavy net losses in FY2022.
Given this backdrop, the best strategy is to focus on the industry leaders and those with proven business models enjoying unit growth and still enjoying strong restaurant-level margins.
However, in a sector where there are still several names with these attributes, it’s tough to decipher which are the best to own. In this update, we’ll compare newly public restaurant operator First Watch (FWRG) with long-time franchiser Dominos Pizza (DPZ) and see which is the better name to own in the current environment.
Scale & Business Model
Dominos and First Watch are akin to David and Goliath from a scale standpoint, with Dominos being the largest pizza company globally with ~19,300 restaurants and First Watch being an emerging breakfast chain with ~450 restaurants.
The differences in the business model are also night and day, with Dominos being a 98% franchised model with a significant international footprint and First Watch being a primarily company-owned company model, with just 22% of its restaurants being franchised currently.

While Dominos’ operators have seen some headwinds due to elevated cheese prices and difficulty securing drivers from a margin standpoint, Dominos is more inflation-resistant than First Watch, given its franchised model where operators bear the brunt of higher costs.
The good news is that First Watch still has very respectable restaurant-level margins, even if they dipped 440 basis points in the most recent quarter. Besides, this margin erosion was largely due to a conservative pricing approach to maintain its value proposition. Plus, as its alcohol mix grows and it’s rolled out to 100% of the system, we could see some additional benefit from a margin standpoint.
That said, Dominos is the clear winner from strictly a margin standpoint, with 30% plus gross margins and double-digit operating margins vs. First Watch at 21% and 4%, respectively, on a trailing-twelve-month basis.
Domino’s Pizza – 1 / First Watch – 0
Unit Growth & Positioning In A Recessionary Environment
Moving to unit growth, First Watch is the leader by a wide margin, with considerable white space (~450 restaurants in 28 states vs. ambitions of up to 2,500 restaurants) and consistent double-digit unit growth rates. Meanwhile, Dominos has continued to grow at an impressive pace given its scale but will be lucky to grow at 5% this year and 4% next year.
However, from a positioning standpoint, pizza tends to hold up better than casual dining occasions, given its relatively low average check to feed the family, the ability to skip tips to keep checks low when picking up, and convenience. In fact, Dominos started paying guests for picking up earlier this year with a $3 tip in the form of online credit.
That said, First Watch’s traffic is clearly suggesting a different story, with it being one of the only brands industry-wide to see positive but high single-digit traffic growth in Q2 (8.1%). This suggests that First Watch’s differentiated menu might make it more recession-resistant than some of its casual dining breakfast peers.
It’s also possible that its breakfast daypart might be stickier, with it being a tradition for many families to go out for breakfast on weekends without breaking the bank vs. a higher check dinner occasion.
So, with better unit growth and what appears to be similar positioning in a recessionary environment due to recent traffic trends, First Watch wins in this category.
Domino’s Pizza – 1 / First Watch – 1
Valuation
Finally, from a valuation standpoint, Dominos is not cheap at first glance, trading at ~22x FY2023 earnings estimates in a recessionary environment with some margin compression. That said, Dominos has historically traded at 27.8x earnings (15-year average), and even using a 5% discount to this multiple (26.4 x 27.8) places a fair value on the stock of $393.40.
Meanwhile, First Watch trades at 47x FY2023 earnings estimates, and while a premium valuation is justified, this is not cheap when the S&P-500 (SPY) is in a cyclical bear market, and growth stocks are being taken down due to multiple compression.
So, while I think there is some upside for FWRG long-term as its earnings play catch-up, DPZ is the more attractive bet from a valuation standpoint.

Domino’s Pizza – 2 / First Watch – 1
Final Verdict
Dominos and First Watch both make excellent buy-the-dip candidates, but neither are in low-risk buy zones just yet, even if Dominos is the better restaurant stock to own on the above criteria, slightly edging out the newly listed and high-growth breakfast concept, FWRG.
However, if we were to see DPZ decline below $292.00, or FWRG below $14.20, I would view pullbacks to these levels as buying opportunities.
For now, I see safer bets elsewhere in Retail, such as Capri Holdings (CPRI), which trades at less than 6.5x FY2023 earnings estimates.
Disclosure: I am long CPRI
Taylor DartINO.com Contributor
Disclaimer: This article is the opinion of the contributor themselves. Taylor Dart is not a Registered Investment Advisor or Financial Planner. This writing is for informational purposes only. It does not constitute an offer to sell, a solicitation to buy, or a recommendation regarding any securities transaction. The information contained in this writing should not be construed as financial or investment advice on any subject matter. Taylor Dart expressly disclaims all liability in respect to actions taken based on any or all of the information in this writing.

Restaurant Stocks: “David vs Goliath” Read More »

Inflation Continues To Spiral Higher

Key reports released last week in both the United States and the Eurozone revealed what global citizens have been acutely aware of. Inflation continues to spiral higher and at a staggering level.
This prompted Credit Suisse to issue a dire global economic outlook, saying that the “worst is yet to come”.

The Commerce Department released the latest inflation numbers vis-à-vis the PCE that revealed that the Core PCE jumped 0.6% in August. It shows that inflation is still intense and increasing.
[embedded content]
The preferred gauge used by the Federal Reserve, the PCE (Personal Consumption Expenditures Price Index) revealed that inflation accelerated even more than expected in August. On a year-over-year basis, the core PCE which omits food and energy costs increased 4.9%, above projections of 4.7%.

It was reported by Dow Jones newswires that inflation in the eurozone hit a new record high of 10% in September.

Dow Jones reported, “The consumer price index–a measure of what consumers pay for goods and services–increased 10.0% in September compared with the same month a year earlier after climbing 9.1% in August, according to preliminary data from Eurostat, the European Union’s statistics agency.”
The CPI for the Eurozone differs from the United States in that it was higher energy prices up 40.8% year-on-year in September after a 38.6% increase in August. The latest numbers for the CPI in the United States showed a slight downtick in August from 8.5% to 8.3%.
After five consecutive interest rate hikes including three consecutive 75 basis point rate hikes at the last three FOMC meetings, the Federal Reserve has raised interest from 0 to ¼% in March 2022 to its current range of 3% to 3 ¼% since March.
However, Friday’s report suggests that the Fed’s extremely aggressive rate hikes have yet to lower inflation.
Vice-chair Lael Brainard spoke at a research conference organized by the Board of Governors of the Federal Reserve System and the Federal Reserve Bank of New York, saying, “Inflation is very high in the United States and abroad, and the risk of additional inflationary shocks cannot be ruled out.
She later added that policymakers were “committed to avoiding pulling back prematurely saying that, “Monetary policy will need to be restrictive for some time to have confidence that inflation is moving back to target,”

Last week gold futures basis the most active December contract traded to a low of $1621, a high of $1684.40 and as of 5 PM, EDT is currently fixed at $1668.30 after factoring in Friday’s net decline of 0.02% or $0.30.
Until December gold can effectively close above $1680 per ounce there is still an extreme danger that gold could drift lower if severe dollar strength as witnessed recently continues.

Chart 4 is a daily chart of the dollar index in Heikin-Ashi format. It differs from a standard candlestick chart in that the open is fixed from the prior candle’s midpoint. It clearly illustrates a potential pivot looking at the third candle from the right which is green and has an extremely small real body and long upper and lower wicks. This is followed by the two green candles.

Chart 5 is also a daily Japanese chart in Heikin-Ashi format. It shows the opposite pivot with a series of red candles up until three days ago when the candle color changed from red to green with a small green real body with long upper and lower wicks.
Both of these charts are indicating that on a technical basis we could see a short-term pivot with the dollar moving from extremely bullish to bearish, and gold moving from extremely bearish to bullish.
For those who would like more information simply use this link.
Wishing you, as always good trading,Gary S. WagnerThe Gold Forecast

Inflation Continues To Spiral Higher Read More »

pexels-photo-164527.jpeg

The Dollar Has Hit The First Target

The king currency has finally hit the first long-term target of $114 that was set in the summer of a distant 2019 when it traded around $96.
That aim wasn’t clear then as the dollar index (DX) looked weak in the chart. The short-term structure was similar to a pullback after a heavy drop.
The majority of readers did not believe the DX would ever raise its head as you can see in the 2019 ballot results below.

However, I had found a bullish hint in a very big map, and I warned you “Don’t Get Trapped By Recent Dollar Weakness”.

Back in August, you had already been more bullish on the dollar as you voted the most for the target of $121.3 in the earlier post. This confidence is due to the certain position of the Fed, which resolutely fights the inflation, lifting the rate aggressively round by round.
Let me update the visualization of the real interest rate comparison below to see if the dollar still has fuel to keep unstoppable.
Source: TradingView
The real interest rate differentials are shown on the scale B: blue line for U.S. – Eurozone, orange line for U.S. – U.K. and the red line for U.S. – Japan.
As you can see in the chart above the dollar’s buffer only grows over time as the trend gets even sharper. In August, the blue line was at +2.4%, the orange line was at +2.35% and the red line was at -3.3%. The change is huge in favor of the U.S. compared to its rivals.
Currently, the DX is lagging behind two differentials: U.S. – Eurozone (the largest component of the DX) and U.S. – U.K. (3rd largest component of DX). We can clearly observe the potential of the dollar to close that gap, rallying at least in the area of $120-$123, where the next target of the distant 2001-year top is located.
Let me refresh the technical chart below for more details.
Source: TradingView
This chart above represents the right part of a Giant Double bottom pattern (purple). It emerges accurately as planned as the price is approaching the main barrier of the Neckline.
There is another crucial element in the chart, the uptrend channel (blue dotted). Recently, the price has pierced the upside of it above $114. However, the DX couldn’t consolidate the success and dropped back below the barrier to close the month’s candle underneath.

The price could take two paths from here. The continuation to the upside based on the aggressive tightening is the first option. Another option could put the market on the pause within a consolidation (red down arrow). The former is needed to let the market take a break and reflect on the consequences of the Fed’s actions. This path is not bearish as it is just one of the natural stages of the market to let the latter accumulate enough power for further growth.
The bearish scenario is not considered as the next target of $121 is closer than the first support at $100. That area has been shown in my earlier post. It consists of the simple moving average for the past one year and the large volume profile zone.

 Loading …
Intelligent trades!
Aibek BurabayevINO.com Contributor
Disclosure: This contributor has no positions in any stocks mentioned in this article. This article is the opinion of the contributor themselves. The above is a matter of opinion provided for general information purposes only and is not intended as investment advice. This contributor is not receiving compensation (other than from INO.com) for their opinion.

The Dollar Has Hit The First Target Read More »

Sugar-Coating the Likelihood of a Recession

Does anyone remember when then President Donald Trump told the American population that the Covid-19 lockdowns and spread of the virus that caused the pandemic would all be over by Easter? Or when referring to Covid-19, that it was “the flu”?
During the first few weeks of the pandemic, President Donald Trump downplayed the severity of the virus to not panic the American population. In hindsight, perhaps the early days, especially when the country was in lockdown, it would have been more beneficial to not sugar-coat the virus and the timeline of when the government would lift the lockdown restrictions.
Had President Donald Trump told people the virus would kill hundreds of thousands of people, perhaps we could have stopped the virus from spreading during the lockdowns.
If President Trump hadn’t given a timeline for the lockdowns and the pandemic seeing brighter days, perhaps the government wouldn’t have lost its creditability with so many Americans during the summer of 2020 and its continued response to the pandemic.

Our current situation with the Federal Reserve and its chairman Jerome Powell, is very reminiscent of the early days of the Covid-19 pandemic.
Back in the winter and early spring, Powell told us that inflation was “transitory” and wouldn’t last. He even said current inflation wouldn’t need aggressive monetary policy changes to fall. Then, even when Powell began to raise interest rates, he told Americans that there was a high probability of a soft landing, referring to the idea that the Fed could bring down inflation slowly and gently.
Powell continued to tell us this summer that raising interest rates gradually and methodically would lower inflation but not put the economy in a recession.
Fast forward to just a week ago, and Powell tells us that the “chances of a soft landing are likely to diminish.” Inflation has hardly moved even though the Fed has raised interest rates five times, starting in March 2022. At that time, the Fed increased rates by 0.25%, 0.50% in May, then a 0.75% bump in June, July, and September.
Powell also said at the most recent Fed press conference following its announcement of the September rate hike that “we have to get inflation behind us. I wish there were a painless way to do that. There isn’t.”
The Federal Reserve is increasing interest rates so that borrowing money will become more expensive. Theoretically, fewer people will do it if borrowing money becomes more costly. If fewer people borrow money, spending will be reduced, and thus the economy will slow down. If the economy slows down, inflation or the increase in prices of goods and services will slow.
Slowing inflation is the Fed’s current goal. But Powell is currently sugar-coating that we are staring down the barrel of a recession. As things are now, it is improbable Powell and the Fed can increase interest rates precisely enough to lower inflation without sending us into a recession.
However, just like President Donald Trump didn’t want to come out and scare the world into an all-out panic, Powell is trying to do the same thing. The Fed Chairman wants to warn people but not put them in full panic mode that a recession is imminent.
The fear is that if Powell told us the recession was months away, it would be a self-fulfilling situation. That could be enough to cause people to panic and stop mass spending. A country-wide immediate spending stop would be enough to put the economy into a rapid recession.
One of a few things could happen from a snap recession. One would be the Fed would lose complete control of the situation. They could have a hard time pulling us back out of the recession. Another issue is that the severity of the recession may be worse. Suppose the economy stops immediately, the chances of falling into a profound recession increase.
On our current path, with the Fed sugar-coating the situation and controlling the slowdown, there is a good chance we don’t fall into a long-deep uncontrolled recession.

If you are looking for a few ways to benefit from the coming recession or how to protect your portfolio, take a look at these two articles I recently wrote, Now is the time to Hedge Your Portfolio and ETFs For a Negative Market Turn.
The Direxion Daily S&P 500 Bear 1X Shares ETF (SPDN) and ProShares UltraPro Short QQQ (SQQQ) are two Exchange Traded Funds I discuss in-depth in those articles. But I also like the ProShares S&P 500 Dividend Aristocrats ETF (NOBL), the ProShares Short 20+ Year Treasury ETF (TBF), or my favorite ETF when interest rates are rising, the FolioBeyond Rising Rates ETF (RISR).
If you agree with what the Fed is doing or what you would do differently, let me know in the comments below.
Matt ThalmanINO.com ContributorFollow me on Twitter @mthalman5513
Disclosure: This contributor did not hold a position in any investment mentioned above at the time this blog post was published. This article is the opinion of the contributor themselves. The above is a matter of opinion provided for general information purposes only and is not intended as investment advice. This contributor is not receiving compensation (other than from INO.com) for their opinion.

Sugar-Coating the Likelihood of a Recession Read More »

3 Stocks to Leave Out of Your Retirement Portfolio

The Fed announced its third consecutive 75-bps interest rate hike last week, which has caused the benchmark indices to plunge. The S&P 500 has lost 5.2% over the past week and 23.3% year-to-date. Moreover, Goldman Sachs slashed its 2022 year-end S&P 500 target to 3600, down 16.3% from 4300.
According to Chris Zaccarelli, Chief Investment Officer, Independent Advisor Alliance, Charlotte, NC, “The Fed is going to raise rates until inflation comes back down, and they will cause a recession in the process.”
Also, Steve Hanke, a professor of applied economics at Johns Hopkins University, said, “The probability of recession, I think it’s much higher than 50% — I think it’s about 80%.”
Given the uncertain economic outlook, fundamentally weak stocks Uber Technologies, Inc. (UBER), Workhorse Group Inc. (WKHS), and AppHarvest, Inc. (APPH) might be best avoided for your retirement portfolio. These stocks do not pay dividends, which is the key requirement for a stock to be added to a retirement portfolio.
Uber Technologies, Inc. (UBER)
UBER develops and operates proprietary technology applications in the United States, Canada, Latin America, Europe, the Middle East, Africa, and the Asia Pacific. The company operates through three segments: Mobility; Delivery; and Freight.

On September 25, 2022, Pomerantz LLP announced the filing of a class action lawsuit against UBER and some of its officers, alleging violations of federal securities laws. The suit is on behalf of a class of all persons and entities except Defendants that purchased or acquired UBER common stock between May 31, 2019, and July 8, 2022.
UBER’s revenue came in at $8.07 billion for the second quarter that ended June 30, 2022, up 105.5% year-over-year. However, its net loss came in at $2.60 billion compared to an income of $1.14 billion in the year-ago period. Moreover, its loss per share came in at $1.33, compared to an EPS of $0.58 in the prior-year period.
UBER’s EPS is expected to decline 367% year-over-year to negative $4.67 in 2022. Its EPS is estimated to remain negative in 2023. It missed EPS estimates in three of the four trailing quarters. Over the past year, the stock has lost 42.3% to close the last trading session at $26.89.
UBER’s POWR Ratings reflect its poor prospects. It has an overall grade of D, which indicates a Sell. The POWR Ratings assess stocks by 118 different factors, each with its own weighting.
Also, the stock has a D grade for Value, Momentum, Stability, and Sentiment. UBER is ranked #57 out of 80 stocks in the D-rated Technology – Services industry. Click here to learn more about POWR Ratings.
Workhorse Group Inc. (WKHS)
Technology company WKHS designs, manufactures and sells zero-emission commercial vehicles in the United States. In addition, the company designs and builds high-performance, battery-electric vehicles, including trucks and aircraft, as an American original equipment manufacturer.
On August 9, 2022, Roth Capital analyst Craig Irwin downgraded WKHS from Buy to Neutral.
WKHS’ sales decreased 99% year-over-year to $12,555 for the second quarter ended June 30, 2022. Its cash and cash equivalents came in at $140.06 million for the period ended June 30, 2022, compared to $201.65 million for the period ended December 31, 2021. Also, its total operating expenses came in at $18.06 million, up 97.8% year-over-year.
Street expects WKHS’ revenue to decline 2,280.8% year-over-year to $18.58 million in 2022. Its EPS is estimated to remain negative in 2022 and 2023. It missed EPS estimates in all four trailing quarters. Over the past year, the stock has lost 64.2% to close the last trading session at $2.69.
WKHS has an overall F grade, equating to a Strong Sell in the POWR Ratings system. Also, it has an F grade for Value and Stability and a D grade for Sentiment and Quality.
It is ranked #55 out of 64 stocks in the D-rated Auto & Vehicle Manufacturers industry. Click here to learn more about POWR Ratings.
AppHarvest, Inc. (APPH)
APPH, an applied agricultural technology company, develops and operates indoor farms to grow non-GMO produce free of chemical pesticide residues. Its products include tomatoes, fruits, and vegetables, such as berries, peppers, cucumbers, and salad greens.
On August 1, 2022, APPH declared that it secured $50 million across two loans guaranteed by the United States Department of Agriculture through Greater Commercial Lending, a Greater Nevada Credit Union subsidiary.
APPH’s President, David Lee, said, “This funding agreement with the USDA allows us to continue to scale operations as we plan to bring the Somerset farm and two additional CEA (controlled environment agriculture) facilities online before the end of the year.”
However, the company’s liabilities are already rising with a receding cash balance, and such additional loans or borrowings might contribute to a deteriorating balance sheet.

For the second quarter ended June 30, 2022, APPH’s net sales came in at $4.36 million, up 38.9% year-over-year. However, its cash and cash equivalents came in at $50.94 million for the period ended June 30, 2022, compared to $150.75 million for the period ended December 31, 2021. Its long-term debt came in at $121.41 million, compared to $102.64 million for the same period.
APPH’s EPS is expected to fall 19.1% year-over-year to a negative $1.31 in 2022. Its EPS is expected to remain negative in 2023. Over the past year, the stock has lost 71.7% to close the last trading session at $1.89.
APPH’s POWR Ratings are consistent with this bleak outlook. The stock has an overall F rating, equating to a Strong Sell in this proprietary rating system. In addition, the stock has an F grade for Value, Stability, and Quality and a D grade for Growth.
It is ranked #83 out of 86 stocks in the Food Makers industry. Click here to learn more about POWR Ratings.

About the Author
Riddhima Chakraborty is a financial journalist with a passion for analyzing financial instruments. With a master’s degree in economics, she helps investors make informed investment decisions through her insightful commentaries. Riddhima is a regular contributor for StockNews.com.

3 Stocks to Leave Out of Your Retirement Portfolio Read More »