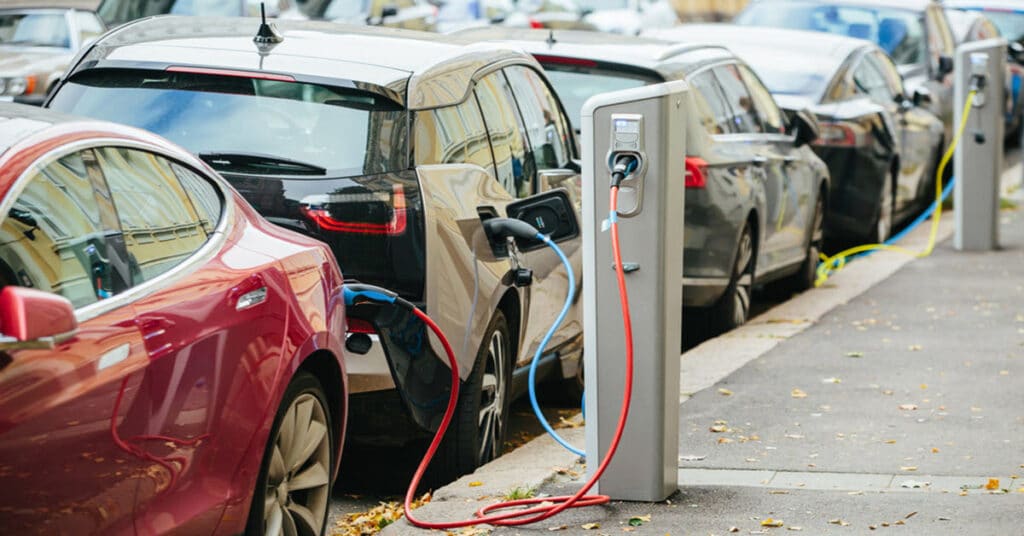
Electric Vehicle Exposure That’s Not Tesla
Just a few years ago, it seemed that electric vehicles were never going to “catch on,” whether that was because of price, possible reliability issues, or, most importantly, range anxiety. (Range anxiety is the fear that the electric vehicle will not have enough battery to reach its destination or the next charging station, ultimately leaving the driver stranded.)
But, better, much better battery technology, vastly more vehicle and brand options for consumers to pick from, and exponentially more charging stations located all over the country, have changed consumers’ minds about the electric car.
While a large number of new, start-up car manufacturers are developing only electric vehicles, one significant change we are seeing is that almost every major car manufacturer is already offering fully electric vehicles or plans to do so in the next few years.
This is nice because we can get our iconic-looking vehicles in electric form; think the Ford F150 pickup truck, the Jeep Grand Cherokee, or even the gas-guzzling Hummer!
Most people don’t like change. Thus changing the way a vehicle looks and what powers it may have been some of the reasons consumers didn’t rush to get an electric car a few years ago but are now more willing to do so.
Regardless of the reason or reasons why more people are purchasing electric vehicles, the fact is, it appears electric vehicles are not only here to stay but may be the only type of cars on the road in just a few decades. This major shift in how we move from one place to another can also be a massive windfall for your portfolio.
Even though some people may feel they missed the EV investment because they didn’t buy Tesla 5 years ago, there are still plenty of opportunities out there that you can put money into today and reap the rewards for decades to come.
Let’s take a look at a few Exchange Traded Funds that will expose you to not just car manufacturers in the EV space but also crucial materials and technologies that EVs need to operate.
The first two are ETFs that focus on the production of electric vehicles and the future of transportation. The KraneShares Electric Vehicles and Future Mobility Index ETF (KARS) and the Fidelity Electric Vehicles and Future Transportation ETF (FDRV) invest in essentially the same companies.
However, each has just slightly different top holdings, the number of holdings, and performance. The expense ratio is the most significant difference between the two ETFs, with KARS at 0.70% and FDRV at just 0.39%.
Global X Autonomous & Electric Vehicles ETF (DRIV) is a little of a hybrid electric car ETF. It invests in stocks in the development, production, and supporting technologies of electric vehicles and autonomous driving. DRIV’s top holdings include Apple, NVIDIA, Microsoft, Toyota, Alphabet, Intel, Tesla, and General Motors.
The SPDR S&P Kensho Smart Mobility ETF (HAIL), the iShares Self-Driving EV and Tech ETF (IDRV), and the Simplify Volt RoboCar Disruption and Tech ETF (VCAR) are all good options if you are looking for an ETF that is more focused on self-driving.
All three still have a lot of exposure to electric vehicles, since up to this point, most autonomous vehicle technologies have been focused on EVs, not combustion engine vehicles.
When I think about self-driving, despite Tesla having a competent self-driving car, I think we are still about five to ten years away from this technology catching on with the mass public. Almost the same timeline that it has taken for electric vehicles to catch on.
So, investing in it today could be a little like investing in Tesla five or ten years ago. But, before you run out and buy one of the above ETFs, you need to remember these are long-term buy-and-hold investments, so know that you will need to be very patient.
And finally, you could always just focus more on the battery side of the EV market because, after all, the electric vehicle will probably not make it very far without the batteries.
The Global X Lithium & Battery Tech ETF (LIT), the Amplify Lithium & Battery Technology ETF (BATT), the WisdomTree Battery Value Chain and Innovation Fund (WBAT), or the S&P Global Core Battery Metals ETF (ION) are all good options.
The four ETFs focus on companies developing, building, or even mining the metals needed for today’s batteries. We all know mining companies are difficult to invest in, so having a wide range of them and some companies that aren’t in the mining industry could be a great way to gain exposure and reduce risk.
Just because you may have missed out on Tesla doesn’t mean you need to miss out on the whole shift to EVs.
Buying ETFs that are focused on EVs is also a great way to spread out your money and not be so focused on “the winner” of the EV race because, just like internal combustion vehicles, there will be a lot of winners in the EV world.
Matt ThalmanINO.com ContributorFollow me on Twitter @mthalman5513
Disclosure: This contributor did not hold a position in any investment mentioned above at the time this blog post was published. This article is the opinion of the contributor themselves. The above is a matter of opinion provided for general information purposes only and is not intended as investment advice. This contributor is not receiving compensation (other than from INO.com) for their opinion.
Electric Vehicle Exposure That’s Not Tesla Read More »