
How does gold and its digital competitor Bitcoin relate to each other?
Gold is a traditional store of value, while Bitcoin from a conventional standpoint is highly risky. Even though the latter was nicknamed “digital gold,” we can see from the chart below that it does not act like one.
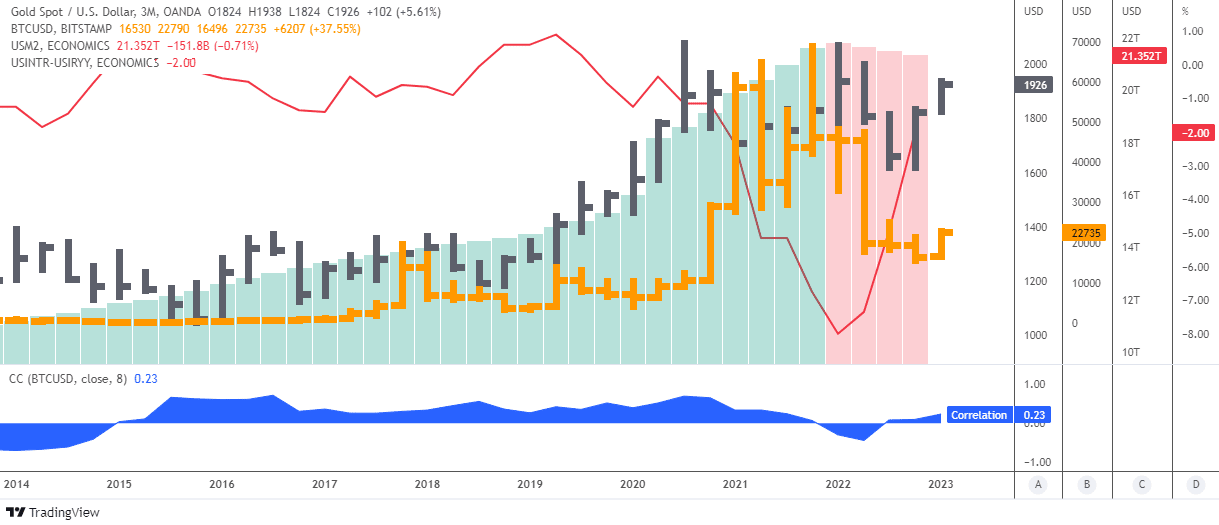
In the above quarterly chart, I combined 5 items:
The gold price is in black bars on scale A. The Bitcoin price is in orange bars on scale B. The U.S. money supply indicator M2 (M2) is in histogram on scale C. The red line represents the U.S. real interest rate (RIR) on scale D. There is a 2-year correlation coefficient of Bitcoin to gold (blue) in the sub-chart.
Both prices of gold and Bitcoin were moving higher with the M2 which has shown the extensive work of the “printing press”. The impact of the pumped money supply can be seen clearly in the dynamics of the RIR, which has fallen in the deep negative zone.
Gold has peaked five quarters ahead of the M2 climax point. However, following the repeated attempt to retest the all-time high, the price has nearly reached it, and the top coincides with M2 as well as with the bottom of the RIR.
Bitcoin has hit the all-time high close to the extreme of M2 and bottom of RIR with amazing accuracy.
While the move was in sync, the real reasons behind it were quite different. Gold buyers were trying to save the value of money. Bitcoin enthusiasts used cheap money to take a risk.
When the “printing press” stopped and M2 collapsed, both the top metal and main coin weakened at different speeds. The rapid growth of RIR forced by the Fed has caused more damage to Bitcoin than to gold: -68% vs -22% since the bottom of RIR. This confirms the speculative nature of the main crypto. This is evident in the next chart as well.
The correlation ratio clearly shows all the above-mentioned sync and de-sync periods. Currently, the link is slightly positive because both instruments are growing against the dollar.
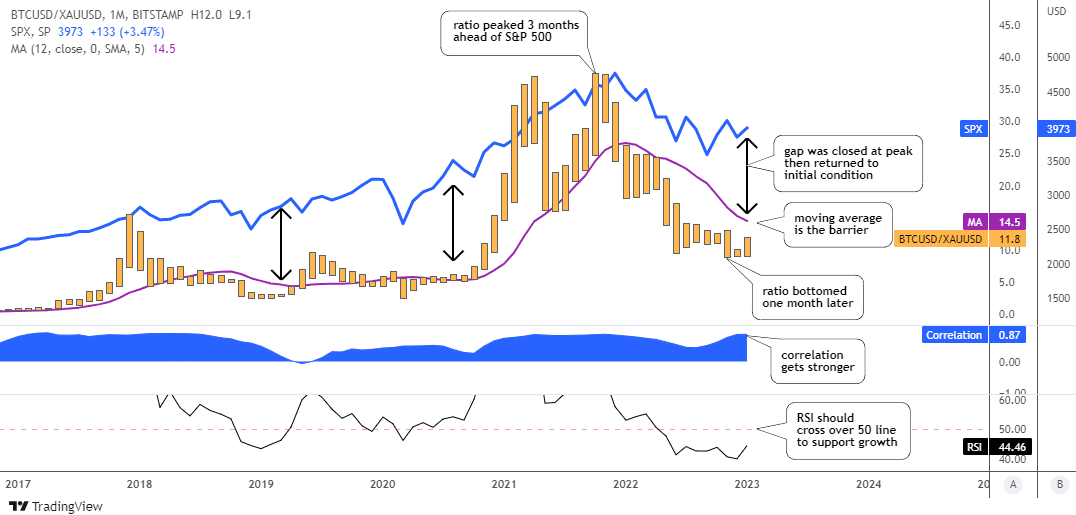
In the above chart, I put Bitcoin vs. gold within the ratio (orange bars) and compared it with the gauge of risk represented by the S&P 500 index (blue line).
Since the correlation ratio is almost 0.87, it has mostly been positive over the past three years. The link has been weakening when the more volatile ratio has been falling sharply compared to the index.
The ratio peaked 3 months earlier than the index did at the start of 2022. If we consider the most recent valley as a bottom, then the ratio reached it 1 month later than the index.
There is a big gap between these instruments on the chart that remains stable over the observed period. It closes only when the Bitcoin/Gold ratio strikes new highs with a much larger amplitude than the S&P 500 matching on the chart.
Both instruments have been recovering after a massive sell-off and the stronger ratio could be a harbinger of renewed appetite for risk as the market thinks that the Fed is about to stop tightening.
The ratio has the 12-month moving average (purple) as the strong barrier at 14.5 ounces ahead. The RSI indicator is moving north and it needs to cross over the 50 line to support further growth.
In order to close the gap with the current S&P 500 level it would require a huge gain of almost three times to reach 30 ounces.
Intelligent trades!
Aibek Burabayev
INO.com Contributor
Disclosure: This contributor has no positions in any stocks mentioned in this article. This article is the opinion of the contributor themselves. The above is a matter of opinion provided for general information purposes only and is not intended as investment advice. This contributor is not receiving compensation (other than from INO.com) for their opinion.
